Figures & data
Figure 1 Illustration of paired corticospinal-motoneuronal stimulation (PMCS). (a). Corticospinal neurons are activated via transcranial magnetic stimulation (TMS) over each motor cortex (green lines). Spinal motor neurons are activated antidromically via peripheral nerve stimulation (purple line). (b). The interstimulus interval (ISI) between paired pulses allows descending volleys, elicited by TMS, to arrive at the presynaptic terminal of corticospinal neurons (1st, green spike) 1–2 ms before antidromic volleys, elicited by peripheral nerve stimulation, arrive at the dendrites of the corresponding spinal motor neurons (2nd, purple spike). The precise timing is measured for each muscle targeted using central and peripheral conduction times.
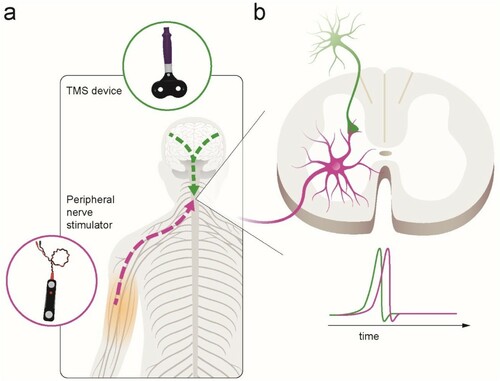
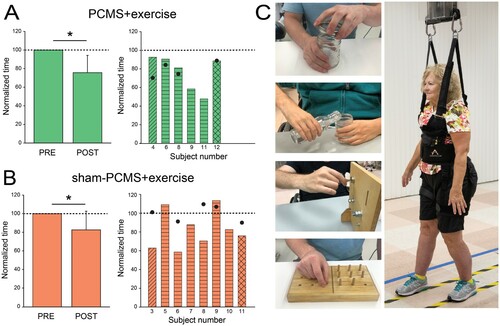
Figure 2 Functional improvements after paired corticospinal-motoneuronal stimulation (PCMS). Graphs show group (left) and individual (right) data for PCMS + exercise (A; n = 6), and sham-PCMS + exercise (B; n = 8)groups. The x-axes show the time of measurements (PRE = pre-assessment; POST = post-as-sessment) and the y-axes show the time to perform tasks as percentage of the time at pre-assessment. The x-axes of the right graphs show indi-vidual subjects and filled circles indicate the 6-month follow-up results. (C) Tests involved subcomponents of the GRASSP and the 10-m walk tests. Data of participants included in the shoulder (transverse lines), hand (horizontal lines), and leg (crossed lines) block are shown for each intervention. Filled circles show individual functional outcomes in a subset of subjects at the 6-month follow-up after PCMS + exercise and sham-PCMS + exercise. Error bars indicate SDs, *P< 5 0.05.