Figures & data
Table 1 Analysis of general clinical data of spinal cord injury with hyponatremia.
Figure 1 The flow chart.
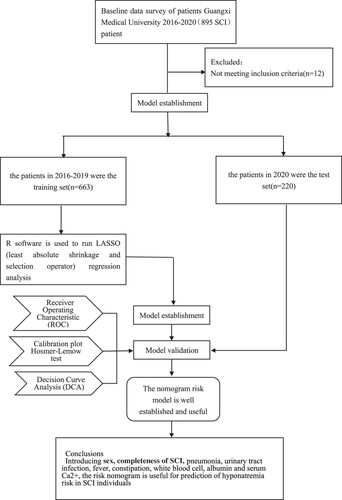
Figure 2 All perioperative parameters were calculated in LASSO analysis. A. Binomial deviance was plotted using the LASSO binary logistic regression model, and 9 parameters were statistically significant. B. Coefcient profles of the 9 features were plotted using the LASSO binary logistic regression model.
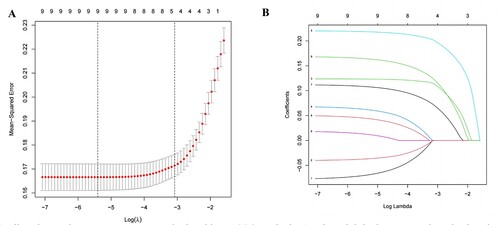
Figure 3 A novel nomogram was constructed to predict hyponatremia after SCI risk by calculating the total score of 9 parameters.
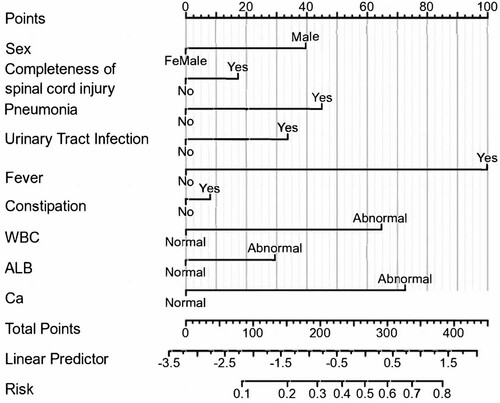
Figure 4 Receiver operating characteristic curve (ROC) validation of the hyponatremia after SCI. The y-axis represents the true positive rate of the risk prediction, the x-axis represents the false positive rate of the risk prediction. The thick blue line represents the performance of the nomogram in the training set (A) and test set (B).
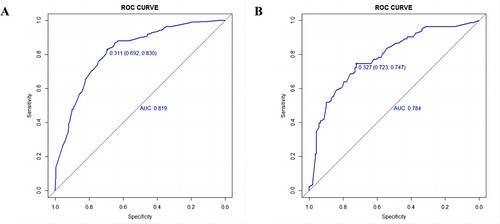
Figure 5 Calibration curves of the predictive hyponatremia after SCI risk nomogram. The y-axis represents actual diagnosed cases of hyponatremia after SCI, the x-axis represents the predicted risk of hyponatremia after SCI. The diagonal dotted line represents a perfect prediction by an ideal model, the solid line represents the performance of the training set (A) and test set (B), and the results indicating that a closer fit to the diagonal dotted line represents a better prediction.
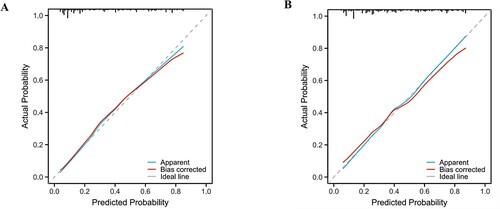
Figure 6 The decision curve analysis. The horizontal axis represents the risk probability threshold, the vertical axis represents the net benefit, and each curve represents the change of the net benefit of each variable (each model) with the risk threshold. All: represents the intervention of all populations, none: represents no intervention. (A) From the training set, (B) from the test set.
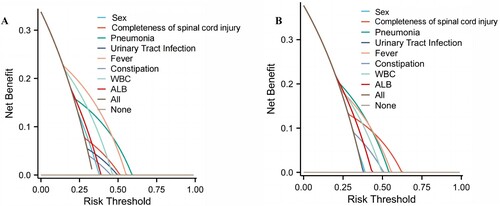
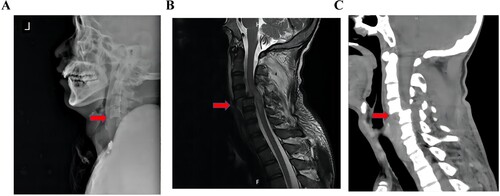
Figure 7 Radiographic examination of the patient with SCI. (A) Lateral radiographs, the arrow points to the 4/5 cervical dislocation. (B) Magnetic resonance imaging (MRI) in the sagittal position, the arrow points to injured cervical spinal cord. (C) Computed tomography (CT) in the sagittal position, the arrow points to the 4/5 cervical dislocation.