5,047
Views
261
CrossRef citations to date
0
Altmetric
Research Article

Tissue Distribution Profiles of the Human TRPM Cation Channel Family

, , , , &
Pages 159-178 | Published online: 10 Oct 2008

Figures & data

Table 1 Primers and probes used for the quantification of expression of each of the TRPM channels.Localization of TRPM primers around the TRP domain region for each channel (Citation5) Kinase or nudix hydrolase domains, in TRPMs 6/7 and 2, respectively

Figure 1. Expression of hTRPM1 mRNA. mRNA profiles in human CNS and peripheral tissues. Data are expressed as copies of TRPM1 mRNA detected normalized to ng mRNA pool to correct for RNA quantity and integrity and are means ± SEM for triplicate reverse transcription reactions from each RNA pool.
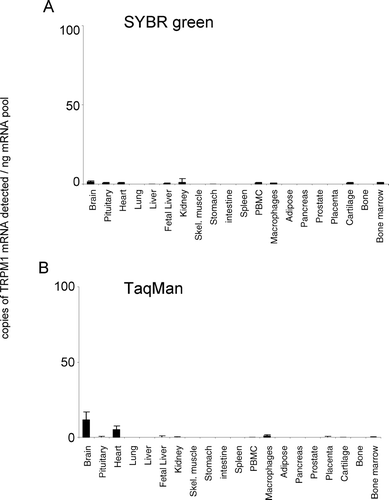
Figure 1. Expression of hTRPM1 mRNA. mRNA profiles in human CNS and peripheral tissues. Data are expressed as copies of TRPM1 mRNA detected normalized to ng mRNA pool to correct for RNA quantity and integrity and are means ± SEM for triplicate reverse transcription reactions from each RNA pool.
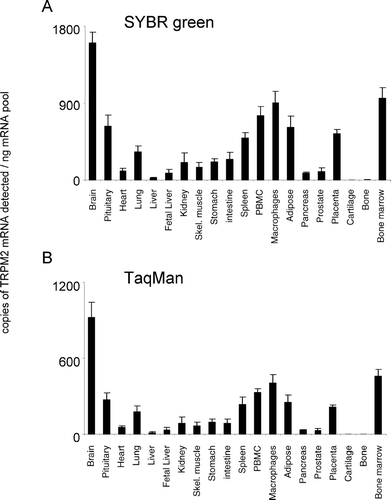
Figure 2. Expression of hTRPM2 mRNA. mRNA profiles in human CNS and peripheral tissues. Data are expressed as copies of TRPM2 mRNA detected normalized to ng mRNA pool to correct for RNA quantity and integrity and are means ± SEM for triplicate reverse transcription reactions from each RNA pool.
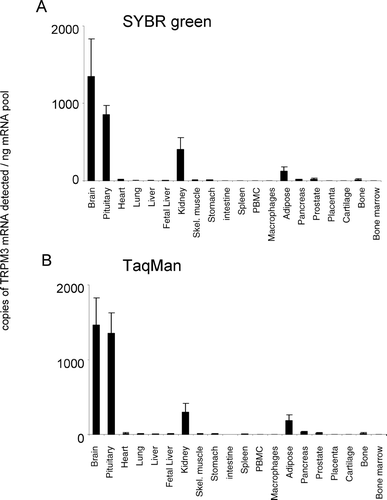
Figure 2. Expression of hTRPM2 mRNA. mRNA profiles in human CNS and peripheral tissues. Data are expressed as copies of TRPM2 mRNA detected normalized to ng mRNA pool to correct for RNA quantity and integrity and are means ± SEM for triplicate reverse transcription reactions from each RNA pool.
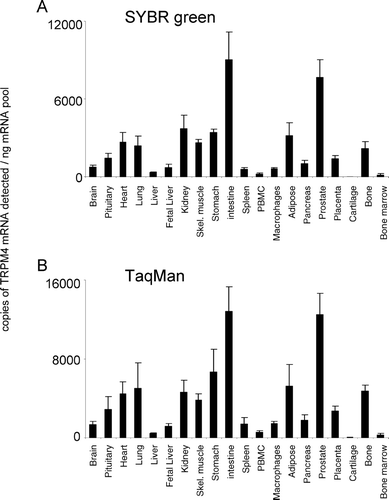
Figure 3. Expression of hTRPM3 mRNA. mRNA profiles in human CNS and peripheral tissues. Data are expressed as copies of TRPM3 mRNA detected normalized to ng mRNA pool to correct for RNA quantity and integrity and are means ± SEM for triplicate reverse transcription reactions from each RNA pool.
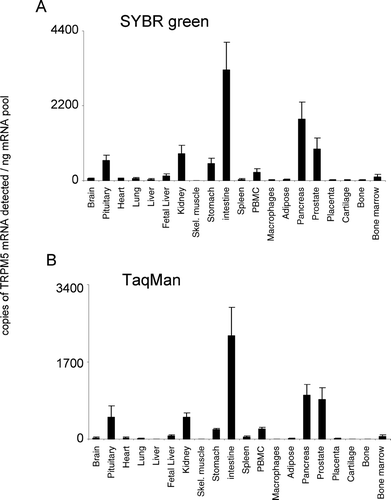
Figure 3. Expression of hTRPM3 mRNA. mRNA profiles in human CNS and peripheral tissues. Data are expressed as copies of TRPM3 mRNA detected normalized to ng mRNA pool to correct for RNA quantity and integrity and are means ± SEM for triplicate reverse transcription reactions from each RNA pool.
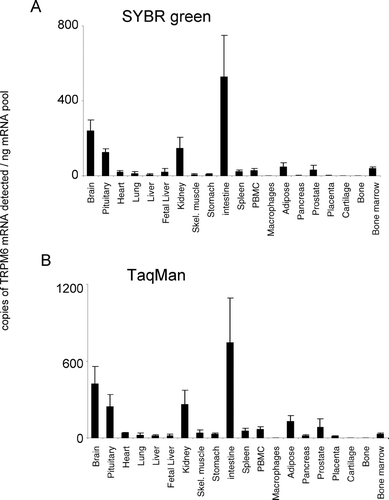
Figure 4. Expression of hTRPM4 mRNA. mRNA profiles in human CNS and peripheral tissues. Data are expressed as copies of TRPM4 mRNA detected normalized to ng mRNA pool to correct for RNA quantity and integrity and are means ± SEM for triplicate reverse transcription reactions from each RNA pool.
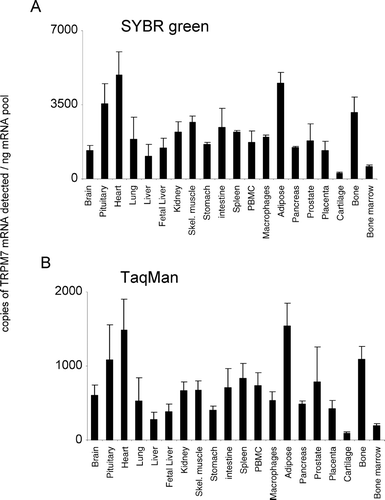
Figure 4. Expression of hTRPM4 mRNA. mRNA profiles in human CNS and peripheral tissues. Data are expressed as copies of TRPM4 mRNA detected normalized to ng mRNA pool to correct for RNA quantity and integrity and are means ± SEM for triplicate reverse transcription reactions from each RNA pool.
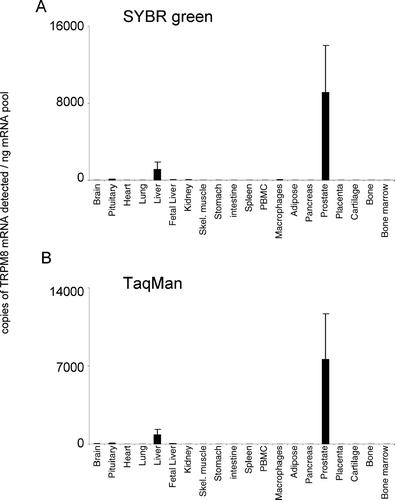
Figure 5. Expression of hTRPM5 mRNA. mRNA profiles in human CNS and peripheral tissues. Data are expressed as copies of TRPM5 mRNA detected normalized to ng mRNA pool to correct for RNA quantity and integrity and are means ± SEM for triplicate reverse transcription reactions from each RNA pool.

Figure 5. Expression of hTRPM5 mRNA. mRNA profiles in human CNS and peripheral tissues. Data are expressed as copies of TRPM5 mRNA detected normalized to ng mRNA pool to correct for RNA quantity and integrity and are means ± SEM for triplicate reverse transcription reactions from each RNA pool.

Figure 6. Expression of hTRPM6 mRNA. mRNA profiles in human CNS and peripheral tissues. Data are expressed as copies of TRPM6 mRNA detected normalized to ng mRNA pool to correct for RNA quantity and integrity and are means ± SEM for triplicate reverse transcription reactions from each RNA pool.

Figure 6. Expression of hTRPM6 mRNA. mRNA profiles in human CNS and peripheral tissues. Data are expressed as copies of TRPM6 mRNA detected normalized to ng mRNA pool to correct for RNA quantity and integrity and are means ± SEM for triplicate reverse transcription reactions from each RNA pool.

Figure 7. Expression of hTRPM7 mRNA. mRNA profiles in human CNS and peripheral tissues. Data are expressed as copies of TRPM7 mRNA detected normalized to ng mRNA pool to correct for RNA quantity and integrity and are means ± SEM for triplicate reverse transcription reactions from each RNA pool.

Figure 7. Expression of hTRPM7 mRNA. mRNA profiles in human CNS and peripheral tissues. Data are expressed as copies of TRPM7 mRNA detected normalized to ng mRNA pool to correct for RNA quantity and integrity and are means ± SEM for triplicate reverse transcription reactions from each RNA pool.

Figure 8. Expression of hTRPM8 mRNA. mRNA profiles in human CNS and peripheral tissues. Data are expressed as copies of TRPM8 mRNA detected normalized to ng mRNA pool to correct for RNA quantity and integrity and are means ± SEM for triplicate reverse transcription reactions from each RNA pool.

Figure 8. Expression of hTRPM8 mRNA. mRNA profiles in human CNS and peripheral tissues. Data are expressed as copies of TRPM8 mRNA detected normalized to ng mRNA pool to correct for RNA quantity and integrity and are means ± SEM for triplicate reverse transcription reactions from each RNA pool.

Reprints and Corporate Permissions

Please note: Selecting permissions does not provide access to the full text of the article, please see our help page How do I view content?

To request a reprint or corporate permissions for this article, please click on the relevant link below:

Academic Permissions

Please note: Selecting permissions does not provide access to the full text of the article, please see our help page How do I view content?

Obtain permissions instantly via Rightslink by clicking on the button below:

If you are unable to obtain permissions via Rightslink, please complete and submit this Permissions form. For more information, please visit our Permissions help page.