Figures & data
Figure 1. Effects of AtRA on the E2-induced (A,B) and basal (B) cell proliferation of MCF7/BUS cells. Cell proliferation is expressed relative to the solvent control (0.2% DMSO) set at 100%. Results represent the average ± SEM of at least three independent experiments. For statistical analysis, ANOVA with Bonferroni’s (A) and Dunnett’s (B) multiple comparison tests were performed. ’’’’p < .0001; ’’’p < .001; ’’p < .01 compared to the E2-treated equivalent control. ***p < .001; **p < .01 compared to the solvent control.
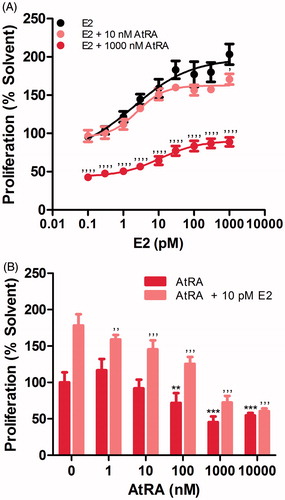
Figure 2. Effects of retinoids on E2-induced (A and B) and basal (B) ERα-mediated expression of the ERE-luciferase gene in U2OS-ERα-Luc cells. ERα activity after 24 h-exposure is expressed relative to the solvent control (0.2% DMSO) set at 100%. Results represent the average ± SEM of at least three independent experiments. For statistical analysis, ANOVA with Bonferroni’s (A) and Dunnett’s (B) multiple comparison tests were performed. ’’’’p < .0001; ’’’p < .001 compared to the E2-treated equivalent control. ***p < .001; **p < .01; *p < .05 compared to the solvent control.

Figure 3. Effects of AtRA (10 μM) and E2 (10 nM) on the transcription of TFF1, PKIB and ERα in the breast cancer cell line MCF7/BUS. Gene expression after 6 h-exposure is expressed relative (fold-induction) to the solvent control (0.2% DMSO) set at 1. Results represent the average ± SEM (n = 3) of three independent experiments. For statistical analysis, Student’s t-tests were carried out. *p < .05 compared to the solvent control. ‘p < .05 compared to the E2-treated sample.
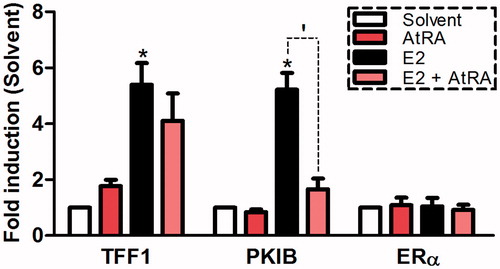
Figure 4. Effects of AtRA on basal and E2-modulated ERα-coregulator binding. Experiments were performed using either MCF7/BUS lysates containing full length ERα (A,B) (three arrays) or purified ERα-LBD-GST (C) (two arrays). Results for all coregulator motifs are expressed as modulation index. For the heat map, hierarchical clustering was carried out. For statistical analysis, Student’s t-tests were carried out. ***p < .001; **p < .01; *p < .05 compared to the solvent control.
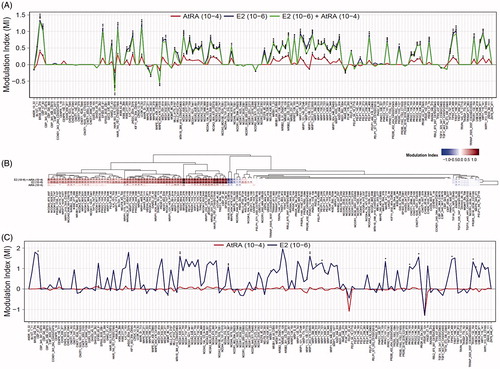
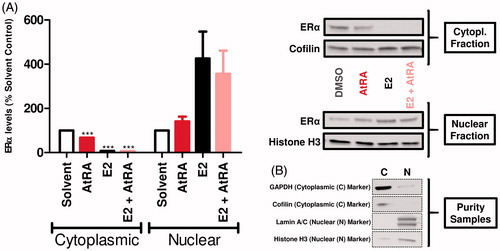
Figure 5. Effects of AtRA (1-h exposure) on the MCF7/BUS subcellular localization of ERα in the absence and presence of E2. After fractionation, cytoplasmic and nuclear ERα was determined by western blot. Semi-quantitative determination of ERα levels was carried out correcting by the housekeeping proteins Cofilin (cytoplasmic fraction) and Histone H3 (nuclear fraction). Results are shown as percentage of the solvent control (Avg ± SEM) set at 100 and are representative of at least five independent experiments (A). In addition, the assessment of the purity of the respective fractions was carried out in singular by using Cofilin/GAPDH (cytoplasmic) and Histone H3/Lamin A/C (nuclear) as fractionation controls (B). For statistical analysis, Student’s t-tests were carried out. ***p < .001 compared to the solvent control.