
Figures & data
Table 1. Primer for qRT-PCR.
Figure 1. hCMPCs proliferation and cell cycle G0/S transition were regulated by miR-33a-5p mimic and inhibitor. (A) Transfection efficiency of miR-33a-5p mimic or miR-33a-5p inhibitor was identified by quantitative real-time polymerase chain reaction (qRT-PCR). U6 was used as the internal reference. (B) After transfection, hCMPCs proliferation was detected by cell counting kit-8 (CCK-8) assay at 24, 48 and 72 h. (C,D) After transfection, hCMPCs cell cycle progression was investigated by flow cytometry. (E-F) After transfection, hCMPCs cell apoptosis was detected by flow cytometry at 48 h. All experiments have been performed in triplicate and experimental data were expressed as mean ± standard deviation (SD). (**p < 0.01, ***p < 0.001, vs. MC; ∧p < 0.05, ∧∧p < 0.01, ∧∧∧p < 0.001, vs. IC) hCMPCs: human cardiomyocyte progenitor cells, MC: mimic control, IC: inhibitor control, M: miR-33a-5p mimic. I: miR-33a-5p inhibitor.
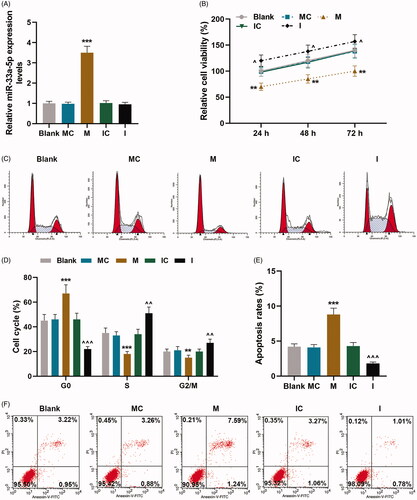
Figure 2. hCMPCs apoptosis was regulated by miR-33a-5p mimic and inhibitor, and NOMO1 was the target gene of miR-33a-5p. (A–C) After transfection, expressions of Bax, Bcl-2 and Cleaved(C) caspase-3 in hCMPCs were measured by qRT-PCR and western blot. GAPDH was used as the internal reference. (D–F) After transfection, expressions of GATA4, cardiac troponin T (cTnT) and myocyte enhancer factor2C (MEF2C) in hCMPCs were detected by qRT-PCR and western blot. GAPDH was used as the internal reference. (G)TargetScan V7.2 was used to predict the binding sites of miR-33a-5p and NOMO1. (H-I) The hCMPCs were co-transfected with wild-type or mutant of NOMO1 (NOMO1-WT; NOMO1-MUT), miR-33a-5p mimic and miR-33a-5p inhibitor, and luciferase activity was measured by dual-luciferase reporter assay. All experiments have been performed in triplicate and experimental data were expressed as mean ± standard deviation (SD). (***p < 0.001, vs. MC; ∧∧∧p < 0.001, vs. IC) hCMPCs: human cardiomyocyte progenitor cells, MC: miR-33a-5p mimic control, IC: miR-33a-5p inhibitor control, NOMO1: nodal modulator 1; Bcl-2: B-cell lymphoma 2; Bax: Bcl-2-associated X protein.
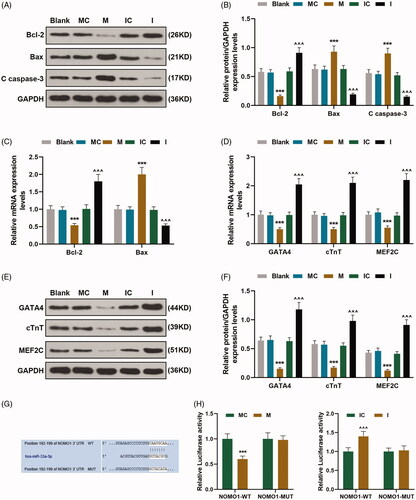
Figure 3. MiR-33a-5p regulated hCMPCs proliferation and cell cycle G0/S transition via overexpressed NOMO1 and siNOMO1. (A,B) Transfection efficiency of overexpressed NOMO1 plasmid and small interfering RNA for NOMO1 (siNOMO) was identified by qRT-PCR. GAPDH was used as the internal reference. (C,D) After transfection, hCMPCs proliferation was detected by cell counting kit-8 (CCK-8) assay at 24, 48 and 72 h. (E,F) After transfection, hCMPCs cell cycle progression was investigated by flow cytometry. All experiments have been performed in triplicate and experimental data were expressed as mean ± standard deviation (SD). (*p < 0.01, **p < 0.05, ***p < 0.001, vs. NC; ∧∧p < 0.01, ∧∧∧p < 0.001, vs. MC; ##p < 0.01, ###p < 0.001, vs. M; §p < 0.05, §§p < 0.01, §§§p < 0.001, vs. NOMO1; Δp < 0.01, ΔΔp < 0.05, ΔΔΔp < 0.001, vs. siNC; εp < 0.01, εεp < 0.05, εεεp < 0.001, vs. IC; †p < 0.01, ††p < 0.05, †††p < 0.001, vs. I; φp < 0.01, φφp < 0.05, φφφp < 0.001, vs. siNOMO1) hCMPCs: human cardiomyocyte progenitor cells, NC: negative control, siNC: negative control for small interfering RNA, siNOMO1: small interfering RNA for NOMO1, M: miR-33a-5p mimic, I: miR-33a-5p inhibitor, MC: mimic control, IC: inhibitor control, NOMO1: nodal modulator 1.
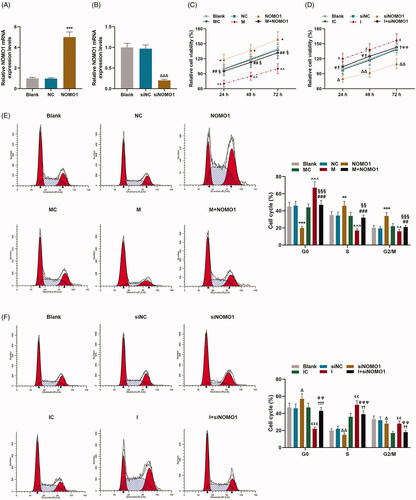
Figure 4. MiR-33a-5p regulated hCMPCs apoptosis via overexpressed NOMO1 and siNOMO1. (A–D) After transfection, hCMPCs cell apoptosis was detected by flow cytometry at 48 h. All experiments have been performed in triplicate and experimental data were expressed as mean ± standard deviation (SD). (***p < 0.001, vs. NC; ∧∧∧p < 0.001, vs. MC; ###p < 0.001, vs. M; §§§p < 0.001, vs. NOMO1; ΔΔΔp < 0.001, vs. siNC; εεp < 0.05, vs. IC; ††p < 0.05, vs. I; φφφp < 0.001, vs. siNOMO1) hCMPCs: human cardiomyocyte progenitor cells, NC: negative control, siNC: negative control for small interfering RNA, siNOMO1: small interfering RNA for NOMO1, M: miR-33a-5p mimic, I: miR-33a-5p inhibitor, MC: mimic control, IC: inhibitor control, NOMO1: nodal modulator 1.
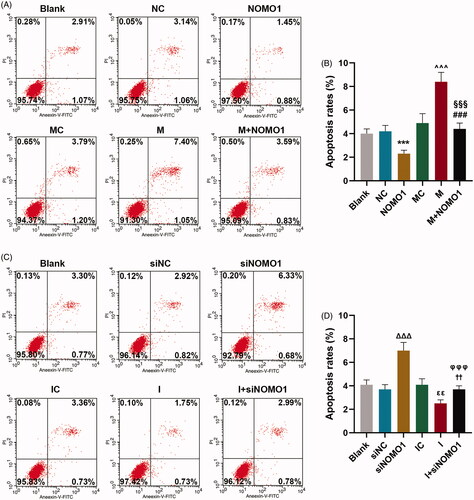
Figure 5. MiR-33a-5p regulated hCMPCs apoptosis-related proteins via overexpressed NOMO1 and siNOMO1. (A–F) After transfection, expressions of Bax, Bcl-2 and Cleaved(C) caspase-3 in hCMPCs were measured by qRT-PCR and western blot. GAPDH was used as the internal reference. All experiments have been performed in triplicate and experimental data were expressed as mean ± standard deviation (SD). (***p < 0.001, vs. NC; ∧∧∧p < 0.001, vs. MC; ###p < 0.001, vs. M; §§§p < 0.001, vs. NOMO1; ΔΔΔp < 0.001, vs. siNC; εεεp < 0.001, vs. IC; †††p < 0.001, vs. I; φφφp < 0.001, vs. siNOMO1) hCMPCs: human cardiomyocyte progenitor cells, NC: negative control, siNC: negative control for small interfering RNA, siNOMO1: small interfering RNA for NOMO1, M: miR-33a-5p mimic, I: miR-33a-5p inhibitor, MC: mimic control, IC: inhibitor control, NOMO1: nodal modulator 1.
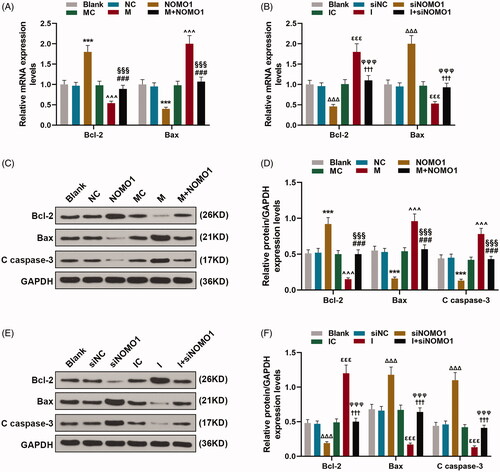
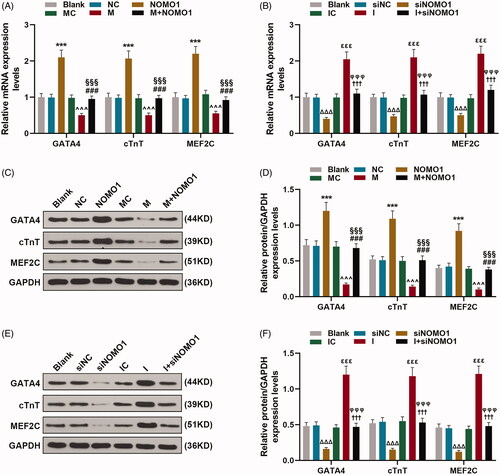
Figure 6. MiR-33a-5p regulated expressions of cardiomyocyte differentiation markers of hCMPCs via overexpressed NOMO1 and siNOMO1. (A–F) After transfection, expressions of GATA4, cardiac troponin T (cTnT) and myocyte enhancer factor2C (MEF2C) in hCMPCs were detected by qRT-PCR and western blot. GAPDH was used as the internal reference. All experiments have been performed in triplicate and experimental data were expressed as mean ± standard deviation (SD). (***p < 0.001, vs. NC; ∧∧∧p < 0.001, vs. MC; ###p < 0.001, vs. M; §§§p < 0.001, vs. NOMO1; ΔΔΔp < 0.001, vs. siNC; εεεp < 0.001, vs. IC; †††p < 0.001, vs. I; φφφp < 0.001, vs. siNOMO1) hCMPCs: human cardiomyocyte progenitor cells, NC: negative control, siNC: negative control for small interfering RNA, siNOMO1: small interfering RNA for NOMO1, M: miR-33a-5p mimic, I: miR-33a-5p inhibitor, MC: mimic control, IC: inhibitor control, NOMO1: nodal modulator 1.
Data availability statement
The analyzed data sets generated during the study are available from the corresponding author on reasonable request.