
Figures & data
Table 1. Primer sequence for RT-qPCR.
Figure 1. Identification of HUCMSCs and their derived Exo. (A) HUCMSC surface markers CD34, CD45, CD29 and CD105 detected by flow cytometry; (B) osteogenic and adipogenic differentiation of HUCMSCs by alizarin red staining and Oil red O staining; (C) the morphology of HUCMSCs-derived Exo observed under TEM; (D) particle size distribution of HUCMSCs-Exo determined by Nanosight analysis; (E) exosomal surface markers TSG101, CD63 and CD81 detected by flow cytometry; (F) H1299 cells and H460 cells co-cultured with extracted exosomes; (G) fluorescence staining of internalization of PKH26-labeled exosomes by H1299 and H460 cells. Each assessment was done in triplicate with 3-time repetition to ensure minimum deviation.
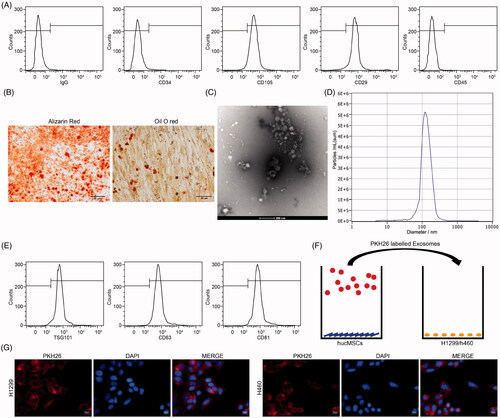
Figure 2. HUCMSCs-derived exosomes inhibit proliferation of lung cancer cells. (A) H1299 and H460 cell viability evaluated by a Cell Titer-Glo assay; (B) cell proliferation evaluated by EdU assays; (C) colony formation of H1299 and H460 cell proliferation; (D) Caspase-3 activity in cells examined by a Caspase-3 kit; (E) detection of apoptosis levels examined by flow cytometry. All experiments were repeated three times. All data are displayed as the mean ± SEM. The differences among groups were compared by a two-way ANOVA followed by Tukey’s post hoc test. *p < 0.05.
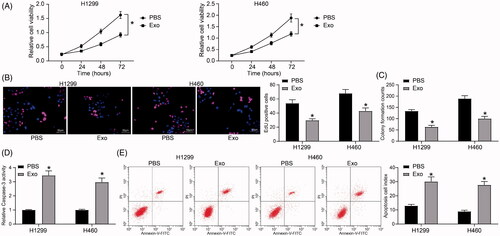
Figure 3. HUCMSCs-derived exosomes inhibit lung cancer cell aggressiveness. (A) the mRNA expression of E-cadherin and N-cadherin in H1299 and H460 cells assayed by RT-qPCR; (B) the protein expression of E-cadherin and N-cadherin in H1299 and H460 cells determined by immunoblotting; (C) the migration of H1299 and H460 cells evaluated by Transwell assays; (D) the invasion of H1299 and H460 cells evaluated by Transwell assays. Each assessment was done in triplicate with 3-time repetition to ensure minimum deviation. All data are displayed as the mean ± SEM. The differences among groups were analyzed by a two-way ANOVA followed by Tukey’s post hoc test. *p < 0.05.
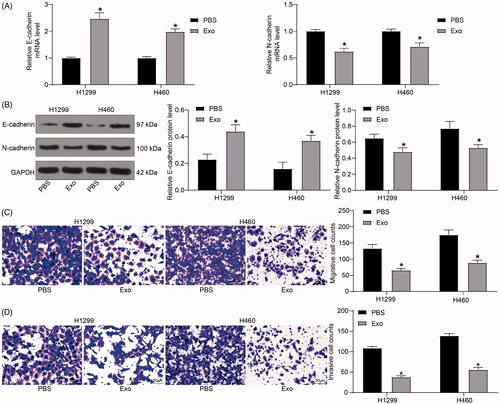
Figure 4. HUCMSCs-derived exosomes increase miR-320a expression in lung cancer cells, while inhibit SOX4 expression. (A) miR-320a expression in H1299 and H460 cells examined by RT-qPCR; (B) the binding sites between miR-320a and SOX4 predicted by the online website Target Scan Human 7.0 (http://www.targetscan.org/) miRNA database; (C) the luciferase activity of SOX4-WT and SOX4-MUT after transfection with mimic control and miR-320a mimic evaluated by dual-luciferase reporter gene assay; (D) the mRNA expression of SOX4 in H1299 and H460 cells examined by RT-qPCR; (E) the protein expression of SOX4 in H1299 and H460 cells examined by immunoblotting; (F) the mRNA expression of Wnt1 and β-catenin in H1299 cells and H460 cells detected by RT-qPCR; (G) the protein expression of Wnt1 and β-catenin in H1299 cells and H460 cells detected by immunoblotting. All experiments were repeated three times. All data are displayed as the mean ± SEM. The differences among groups were analyzed by a two-way ANOVA followed by Tukey’s post hoc test. *p < 0.05, **p < 0.01.
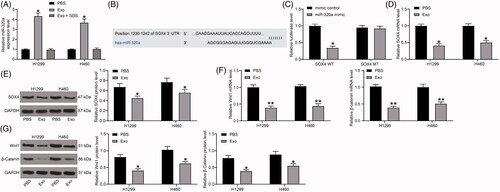
Figure 5. Inhibition of lung cancer cell activity by exosomes is diminished after overexpression of SOX4. (A) SOX4 mRNA expression in H1299 and H460 cells transfected with an overexpression plasmid of SOX4 by RT-qPCR; (B) the mRNA expression of Wnt1 and β-catenin in H1299 cells and H460 cells detected by RT-qPCR; (C) the protein expression of Wnt1 and β-catenin in H1299 cells and H460 cells detected by immunoblotting; (D) cell proliferation evaluated by EdU assays; (E) the migration of H1299 and H460 cells evaluated by Transwell assays; (F) the invasion of H1299 and H460 cells evaluated by Transwell assays. Each assessment was done in triplicate with 3-time repetition to ensure minimum deviation. All data are displayed as the mean ± SEM. The differences among groups were analyzed by a two-way ANOVA followed by Tukey’s post hoc test. *p < 0.01.
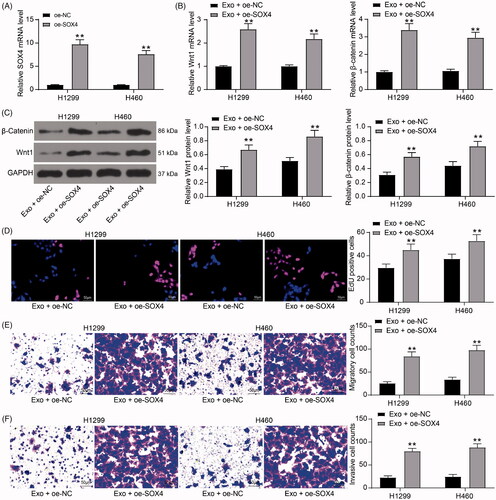
Figure 6. The β-catenin-specific agonist weakens the effects of exosomes on lung cancer cells. (A) the Wnt1 and β-catenin protein levels in H1299 and H460 cells immunoblotting; (B) cell proliferation evaluated by EdU assays; (C) colony formation of H1299 and H460 cell proliferation; (D) Caspase-3 activity in cells examined by a Caspase-3 kit; (E) detection of apoptosis levels examined by flow cytometry; (F) the migration of H1299 and H460 cells evaluated by Transwell assays; (G) the invasion of H1299 and H460 cells evaluated by Transwell assays. All experiments were repeated three times. All data are expressed as the mean ± SEM. The differences among groups were analyzed by a two-way ANOVA followed by Tukey’s post hoc test. *p < 0.05.
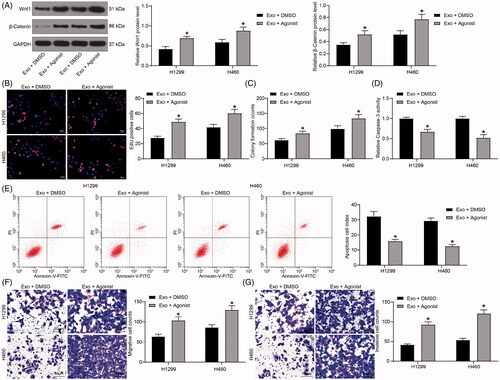
Figure 7. HUCMSCs-derived exosomes inhibit the growth of H1299 cells in vivo. (A) growth rate of tumors formed by H1299 cells in vivo; (B) representative images of tumors; (C) miR-320a expression and mRNA expression of SOX4, Wnt1 and β-catenin in xenograft tumors by RT-qPCR; (D) the staining intensity of KI67 in xenograft tumors examined by immunohistochemical staining. All data are expressed as the mean ± SEM. The differences among groups were analyzed by a two-way ANOVA followed by Tukey’s post hoc test or unpaired t test (n = 5). **p < 0.01.
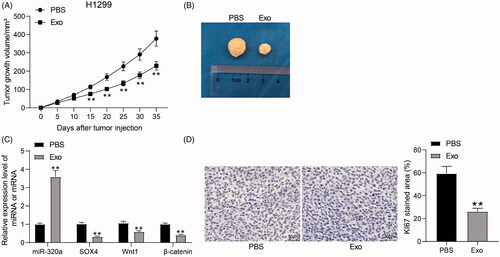
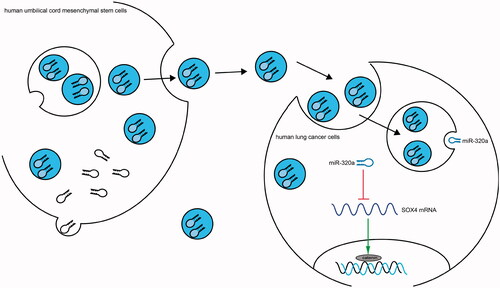
Figure 8. Schematic diagram summarizes the miR‐320a-containing exosomes/SOX4/Wnt/β-catenin axis and its functions in lung cancer. HUCMSCs-derived exosomes block the Wnt/β-catenin pathway and therefore inhibit cell growth and aggressiveness by transferring miR-320a to inhibit SOX4 expression in lung cancer.
Data availability statement
All the data generated or analyzed during this study are included in this published article.