
Figures & data
Table 1. Sequence information of the plasmid.
Table 2. Primer sequences of RT-qPCR.
Figure 1. miR-199a is upregulated in hyperuricemia and induces renal injury. (A) HE staining (×400, scale bar = 50 um). (B) Biochemical analysis of UA in rat serum. (C) miR-199a expression tested by RT-qPCR. (D–F) SCr and UA (D), BUN (E), and mALB (F) contents were determined by biochemical analysis. (G) The degree of renal fibrosis was examined using Masson's staining (200×). NS means not significant. N = 5. *p < 0.05 vs. NC inhibitor group; #p < 0.05 vs. NC mimic group; Results of each group were measured data expressed as mean ± SD. One-way AVONA was used for comparison among groups.
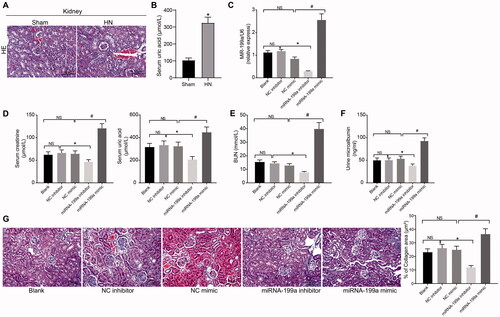
Figure 2. miR-199a targets PPARγ. (A) The binding sites between miR-199a and PPARγ were predicted using bioinformatics analysis. (B) The targeting relation between miR-199a and PPARγ was examined using a dual-luciferase assay. (C,D) PPARγ expression was examined by RT-qPCR (C) and Western blot (D). *p < 0.05 vs. miR-199a NC group; #p < 0.05 vs. NC inhibitor group; &p < 0.05 vs. NC mimic group. NS means not significant. Results of each group were measured data expressed as mean ± SD. One-way or two-way AVONA was used for comparison among groups. N = 5.
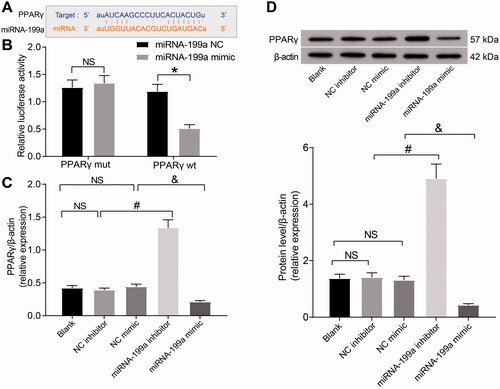
Figure 3. PPARγ-mediated inhibition of β-catenin signaling alleviates HN. (A–C) SCr (A), BUN (B), and mALB (C) contents were determined by biochemical analysis. (D) Images and quantification of Masson's staining. (E,F) Levels of PPARγ and β-catenin target genes were examined by RT-qPCR (E) and WB (F). #p < 0.05 vs. si-NC group. NS means not significant. Results of each group were measured data expressed as mean ± SD. One-way or two-way AVONA was used for comparison among groups. N = 5.
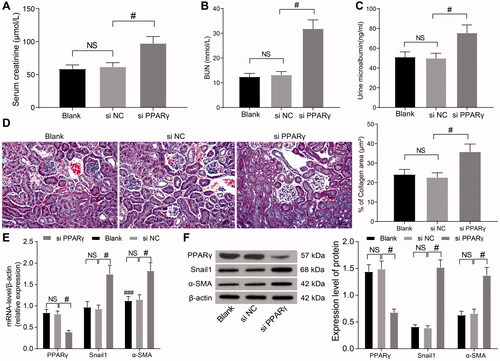
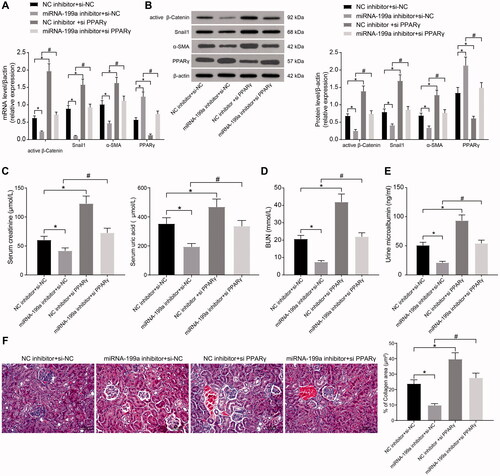
Figure 4. miR-199a can target the PPARγ/β-catenin pathway and promote HN. (A,B) Levels of PPARγ, active β-catenin, and β-catenin target genes were examined by RT-qPCR (A) and Western blot (B). (C–E) SCr and UC (C), BUN (D), and mALB (E) contents were determined by biochemical analysis. (F) Images and quantification of Masson's staining. *p < 0.05 vs. NC inhibitor + si-NC group; #p < 0.05 vs. miR-199a inhibitor + si-NC group. Results of each group were measured data expressed as mean ± SD. One-way or two-way AVONA was used for comparison among groups. N = 5.
Supplemental Material
Download PDF (317.2 KB)Data availability statement
All the data generated or analyzed during this study are included in this published article.