
Figures & data
Table 1. Demographic data and biomarker levels of the patient and control group.
Figure 1. ROC analysis of serum CGRP and PTX-3 levels for the diagnosis of migraine with acute attack.
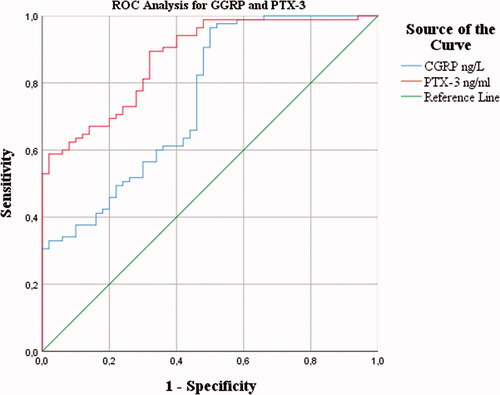
Table 2. Correlation analysis of serum CGRP and PTX-3 levels with the duration of migraine headache and severity of pain.