
Figures & data
Figure 1. EPI reduces epileptiform burst discharge frequency. (A) Generation of hippocampal CA3 activity. Illustrated are pseudo-color images of a single epileptiform burst generated by voltage sensitive dye. (B) Continuous 150 s-long chart recordings of burst discharges are visualized on Axoscope 9.2. Increasing EPI produced a dose-dependent reduction of epileptiform burst activities. (C) Frequency histogram of burst discharges versus time of EPI administration. Each bin represents a 150-s time interval. (D) Concentration–response curve derived from 52 experiments.
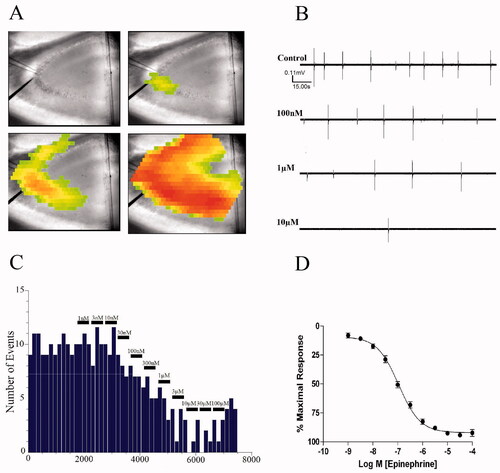
Figure 2. Schild regression analysis using a highly selective α2-AR antagonist. (A) Consecutive EPI concentration–response curves demonstrate a concentration-dependent effect of the selective α2-AR antagonist RS79948. Pretreatment with 3 nM (○), 10 nM (■), and 30 nM (□) of RS79948 produced consecutive parallel rightward shifts of the curve that were significantly different from control (●) (EC50 = 423 ± 148 nM, 1211 ± 204 nM and 3221 ± 1954 nM, respectively, vs. 95 ± 16 nM for control). (B) Using dose ratios calculated from individual experiments illustrated in (A), a Schild plot was created generating a regression slope equaling 0.95 ± 0.11 and an x-intercept correlating to a pKb value of 9.00 ± 0.16 (n = 5).
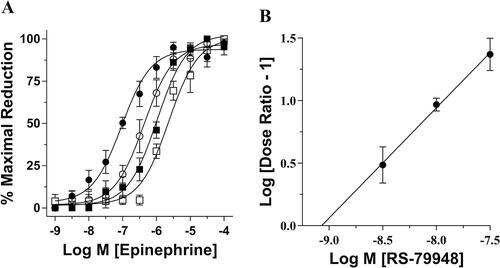
Figure 3. Correlation between experimental and reported pharmacological values for various α-AR ligands at rat or human α2A-ARs. Using the pKi values in Table S1, correlation analyses were performed for the rat α2A- (A), α2B- (B), and α2C-AR (C), or using pKb (D), pEC50 (E), or RE (F) at human α2A-ARs. The correlation coefficient and slope was 0.99 and 1.02, respectively, for the rat α2A-AR. A correlation coefficient and slope of 0.91 and 0.98, respectively, when correlating experimental pEC50 with the published human pEC50 for the α2A-AR. A correlation coefficient and slope of 0.92 and 1.05, respectively, when correlating experimental RE with the published human RE for the α2A-AR. Individual pKb and pKi values can be found in Table S1. Individual pEC50 and relative efficacy values are presented in Table S3. The slope and fit of each correlation are summarized in Tables S2 and S4.
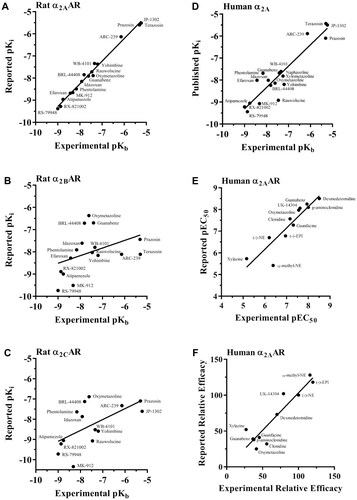
Figure 4. Comparison of various classes of α-AR agonists normalized to percent maximal reduction of NE on epileptiform burst inhibition. (A) The rank order potency for the imidazolines and guanadines is as follows: dexmedetomidine > guanabenz > UK-14304 ≥ oxymetazoline > guanfacine > clonidine ≫ xylazine. (B) The rank order potency for phenethylamines and their derivatives tested is as follows: EPI > 6-FNE ≥ α-methyl-NE > (−)-(R)-NE ≫ (+)-(S)-NE > (−)-Phenylephrine > Isoproterenol.
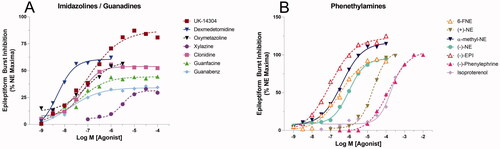
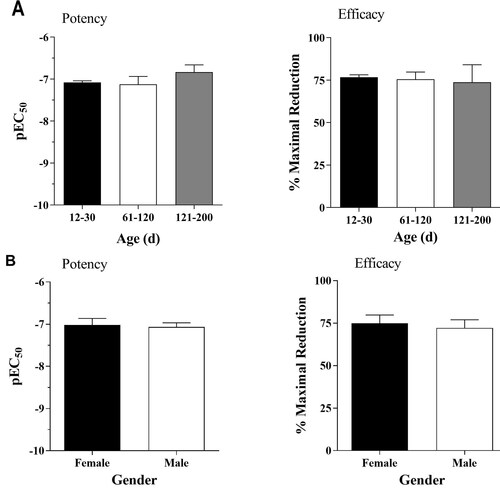
Figure 5. (A) Effects of age on the EPI-mediated inhibition of epileptiform activity. The average EC50 values for the PND12–30, 60–120, and 121–200 groups were 131 ± 10 nM (n = 140), 160 ± 70 nM (n = 9), and 204 ± 79 nM (n = 8), respectively. The average efficacy values for the three groups were 75 ± 2% (n = 140), 75 ± 5% (n = 9), and 73 ± 9% (n = 7), respectively. (B) Sex does not influence EPI-mediated inhibition of epileptiform activity. Age-matched average EC50 values are 93 ± 31 nM (n = 13) and 86 ± 19 nM (n = 13). Age-matched average efficacies are 75 ± 4.9% (n = 13), and 72 ± 4.9% (n = 13). Paired t-tests indicate no statistical significance in age or gender.
Supplemental Material
Download Zip (67.1 KB)Data availability statement
Supplemental data sets are directly available in this manuscript or by contacting the corresponding author, Dr. Van Doze.