
Figures & data
Figure 1. CBLC expression in breast cancer tissues and cells. (A,B) mRNA expression levels of CBL, CBLB and CBLC in paired (A) and unpaired (B) breast cancer samples from TCGA database. (C) mRNA expression level of CBLC in pan-cancers. (D) IHC images showing the expression and location of CBLC in 15 breast cancer tissues and 15 para-carcinoma tissues. CBLC expressions were converted to H-score. (E,F) mRNA (E) and protein (F) expression levels of CBLC in five breast cancer cells and normal breast epithelial cells. *p < 0.05 (normalized to MCF10A cells). (G) Kaplan-Meier Curve shows the overall survival of breast cancer patients with different CBLC expression levels.
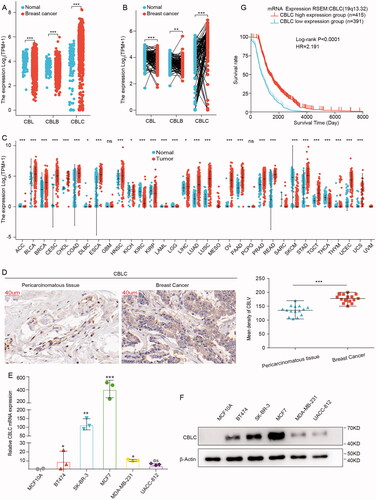
Table 1. The correlation between CBLC expression and the clinical features of breast cancer patients from the TCGA database.
Figure 2. The effects of CBLC in breast cancer cell migration, proliferation and invasion. (A,B) mRNA and protein expression of CBLC in CBLC overexpressing cells and control cells. (C,D) Knockdown efficiencies of three siRNAs targeting CBLC at mRNA and protein levels. **p < 0.01 (compared with siNC). (E) Effect of CBLC overexpression on MDA-MB-231 cell proliferation. **p < 0.01 (compared with control cells on the same day). (F) Growth kinetics of MCF7 cells transfected with siNC or siCBLC3. *p < 0.05 (compared with siNC group on the same day). (G)Migration abilities of CBLC overexpressing cells and control cells (50×). **p < 0.01. (H) Migration and invasion abilities of MCF7cells transfected with siNC or siCBLC3 (100×). **p < 0.01. (I) Migration and invasion abilities of MDA-MB-231-vector cells and MDA-MB-231-CBLC cells (100×). **p < 0.01. (J) Migration and invasion abilities of MCF7 cells transfected with siNC or siCBLC3 (100×). T. **p < 0.01.
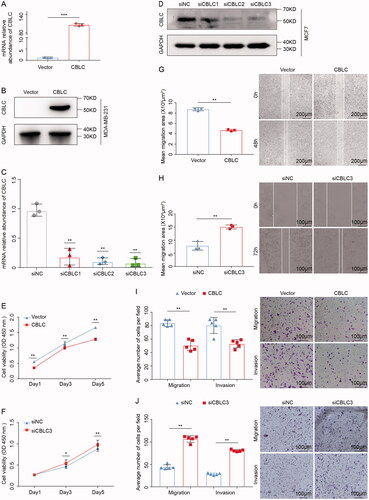
Figure 3. Identification of the interaction between CBLC and CTTN. (A) Silver staining of the protein complex pulled down by Flag-CBLC in 293T cells. (B) Biological process/Cellular component/Molecular function enrichment analysis of CBLC interacting proteins. (C) KEGG pathway enrichment analysis of CBLC interacting proteins. (D,E) Forward (D) and reverse (E) co-IP confirmed the interaction between CBLC and CTTN. (F) CBLC with a green fluorescent protein tag and CTTN with a red fluorescent protein tag were colocalized, as visualized by laser confocal microscopy. The top images show the colocalization of CBLC and CTTN in 293T cells, and the bottom images show the colocalization of CBLC and CTTN in MDA-MB-231 cells (1000×).
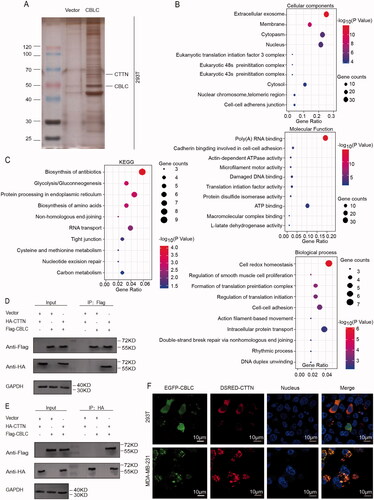
Figure 4. Effect of CBLC on CTTN expression, stability and ubiquitination. (A,B) Effect of CBLC overexpression/knockdown on endogenous CTTN mRNA expression in MDA-MB-231/MCF7 cells. (C,D) Effect of CBLC overexpression/knockdown on CTTN protein expression in MDA-MB-231/MCF7 cells. (E) The stability of CTTN after treatment with cycloheximide (CHX) at different time points in CBLC overexpressing cells and control cells. (F) WB detection of CTTN expression and ubiquitination in MCF7 cells transfected with Flag-CBLC or vector pretreated with MG132. Input: protein expression in the extracted supernatant, Eluate: protein expression after purification by IP. (G) WB detection of CTTN expression and ubiquitination in MDA-MB-231 cells transfected with siNC or siCBLC pretreated with MG132. Input: protein expression in the extracted supernatant, Eluate: protein expression after purification by IP.
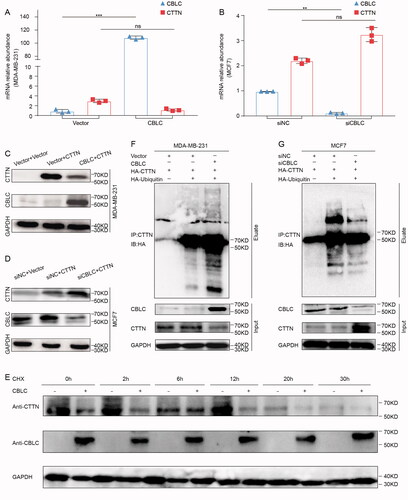
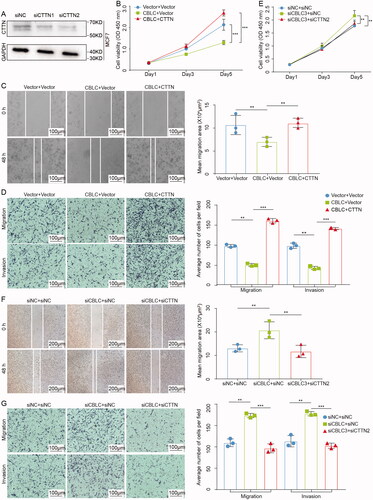
Figure 5. CTTN is the functional target of CBLC. (A) Knockdown efficiencies of three siRNAs targeting CTTN at and protein levels by WB. **p < 0.01 (compared with siNC). (B,E) CCK8 assay of MDA-MB-231-CBLC cells. (B) transfected with the pcDNA3.1/HA-CTTN plasmid, and that of. MCF7-siCBLC cells. (E) transfected with siNC/siCTTN2. (C,F) Wound healing assay of MDA-MB-231-CBLC (C) cells transfected with the pcDNA3.1/HA-CTTN plasmid, (F) and that of MCF7-siCBLC cells transfected with siNC/siCTTN2 100×). (D,G) The transwell assay of MDA-MB-231-CBLC cells (D) transfected with the pcDNA3.1/HA-CTTN plasmid and that of MCF7-siCBLC cells, (G) transfected with siNC/siCTTN2 (100×).
Supplemental Material
Download MS Word (14.1 KB)Data availability statement
The raw data supporting the conclusions of this article will be made available by the authors, without undue reservation.