Figures & data
Figure 1. Appraisal of BMSCs and analyzed using flow cytometry. Flow cytometry for sorting of BMSCs.
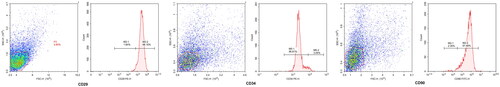
Figure 2. MicroRNA-124a mRNA expression of BMSCs. (A) β-Thiol ethanol reduced microRNA-124a expression of BMSCs. (B) Baicalin reduced microRNA-124a expression of BMSCs. *p < 0.05 compared with β-thiol ethanol at 0 h group or baicalin at 0 h group.
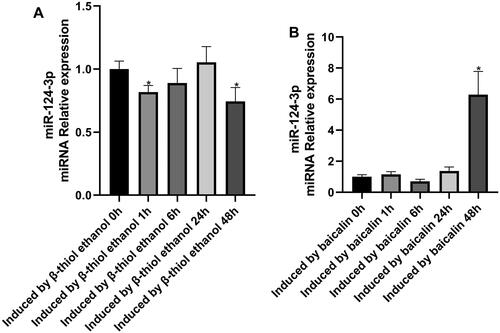
Figure 3. β-thiol ethanol or baicalin controlled apoptosis of BMSCs. (A) β-Thiol ethanol reduced apoptosis of BMSCs. (B) Baicalin reduced apoptosis of BMSCs. *p < 0.05 compared with β-thiol ethanol at 0 h group or baicalin at 0 h group.
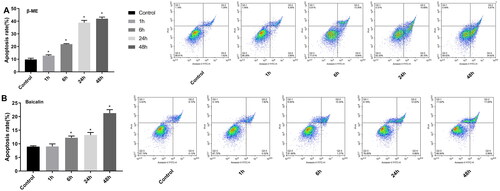
Figure 4. MicroRNA-124a inhibitor reduced microRNA-124a expression in BMSCs. The RT-PCR results of microRNA-124a expression. *p < 0.05 compared with β-thiol ethanol at 0 h group or baicalin at 0 h group.
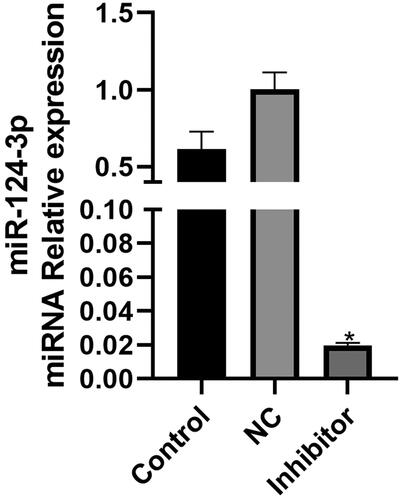
Figure 5. MicroRNA-124a is one target for the effects of β-thiol ethanol or baicalin on cell growth of BMSCs. The MTT results of BMSCs with different treatment. *p < 0.05 compared with inhibit NC.
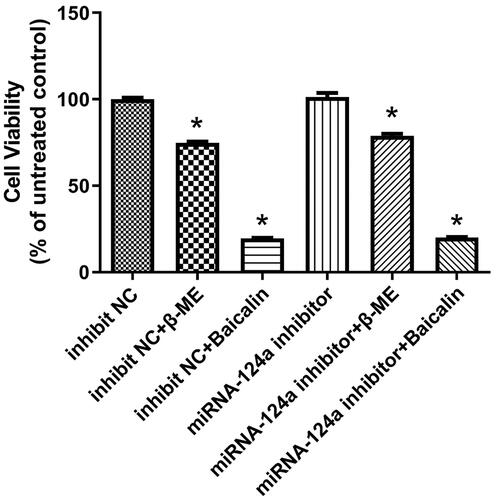
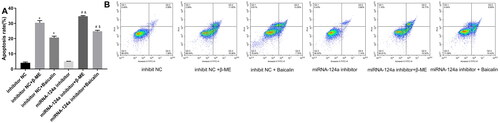
Figure 6. MicroRNA-124a Is one target for the effects of β-thiol ethanol or baicalin on apoptosis of BMSCs. (A) Apoptosis rate of BMSCs. (B) Apoptosis assay using flow cytometry. *p < 0.05 compared with inhibit NC.