Figures & data
Table 1. Overview of number of cases concerning incidents with cleaning agents and disinfectants during the follow-up period, number that received a request to share contact details for further information about study participation and number of cases for which interviews were conducted.
Figure 1. Number of occupational cases and number of cases involving cleaning products, registered by the Swedish Poisons Information Centre for the period 2010–2014.
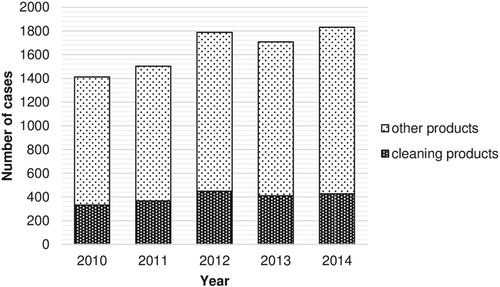
Table 2. Overview of occupational cases involving cleaning agents and disinfectants recorded by the Swedish PIC for adults during 2010–2014: number of cases and proportion of minor, moderate and risk cases (%).
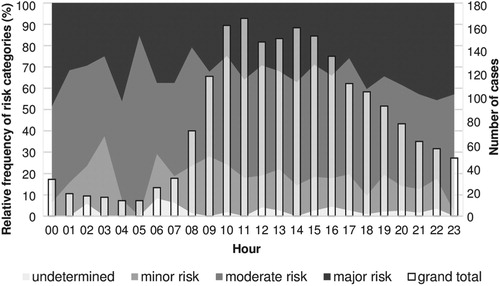
Figure 2. Relative frequency of risk categories as judged by the Poisons Information Centre expert on calls stacked to 100% for each hour starting with 00:00–00:59 (left axis) and total number of occupational cases involving cleaning agents per hour for the years 2010–2014 (bars, right axis).