
Figures & data
Figure 1. Flow diagram of the study selection protocol.
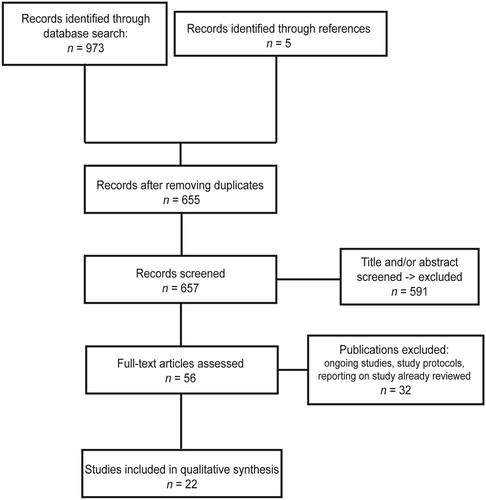
Table 1. Measuring tools used in the included studies.
Figure 2. Effects of interventions on energy expenditure.
Note: IV = inverse variance; CI = confidence interval; 3.1 [Citation49] = cycling intervention at 20% of maximal aerobic power; 3.2 [Citation49] = cycling intervention at 50% of maximal aerobic power: 4.1 [Citation55] = walking intervention at speed 1.6 km/h; 4.2 [Citation55] = walking intervention at speed 3.2 km/h; 4.3 [Citation55] = walking intervention at speed 4.8 km/h; 5.1 [Citation53] = walking intervention at speed 1.6 km/h; 5.2 [Citation53] = walking intervention at speed 3.2 km/h; 5.3 [Citation53] = walking intervention at speed 4.8 km/h.
![Figure 2. Effects of interventions on energy expenditure.Note: IV = inverse variance; CI = confidence interval; 3.1 [Citation49] = cycling intervention at 20% of maximal aerobic power; 3.2 [Citation49] = cycling intervention at 50% of maximal aerobic power: 4.1 [Citation55] = walking intervention at speed 1.6 km/h; 4.2 [Citation55] = walking intervention at speed 3.2 km/h; 4.3 [Citation55] = walking intervention at speed 4.8 km/h; 5.1 [Citation53] = walking intervention at speed 1.6 km/h; 5.2 [Citation53] = walking intervention at speed 3.2 km/h; 5.3 [Citation53] = walking intervention at speed 4.8 km/h.](/cms/asset/8c5a1548-8e92-474b-b256-928107b83b2e/tose_a_1562688_f0002_ob.jpg)
Supplemental material