Figures & data
Table 1. Test sample density.
Figure 1. Structure of non-Newtonian foamed materials: (a–c) sample P1, (d–f) sample P2 and (g–i) sample P3 real view, computer analysis image and pore distribution in the sample structure, respectively. Note: The full colour version of this figure is available online.
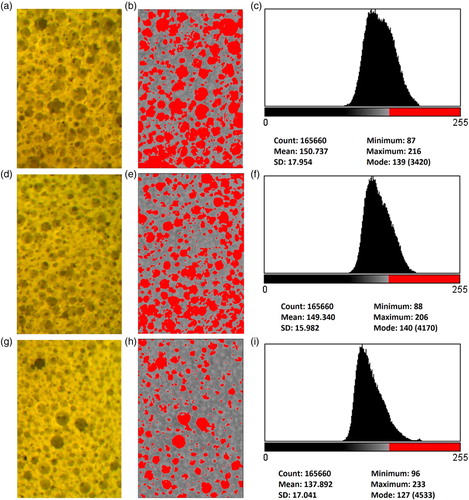
Table 2. Summary of quantitative computer image analysis of the structure of the tested materials.
Figure 2. The impact test measuring stand (CIOP-PIB, Poland): 1 = vertical frame, 2 = ram beam, 3 = base of 350 kg weight, 4 = sample deflection sensor, 5 = ram, 6 = anvil with a force sensor.
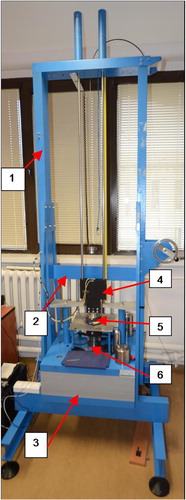
Table 3. Energy suppressed in the sample (Es) values for P1, P2 and P3 sample types at temperatures T1 = –30 °C, T2 = –20 °C, T3 = –10 °C, T4 = 20 °C and T5 = 50 °C.
Figure 3. Energy suppressed in the sample (Es) according to temperature (T1 = –30 °C, T2 = –20 °C, T3 = –10 °C, T4 = 20 °C and T5 = 50 °C) for samples P1, P2 and P3 (with linear fitting).
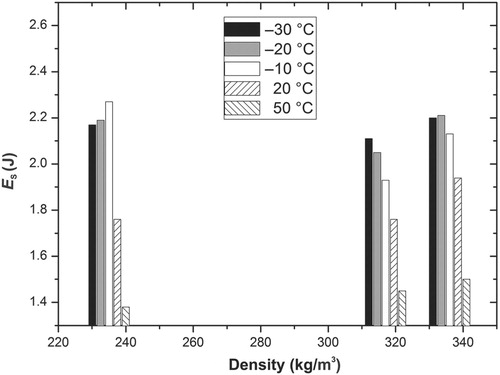
Figure 4. Energy suppressed in the sample (Es) according to temperature (T) for samples (a) P1, (b) P2 and (c) P3 (with linear fitting and SD).
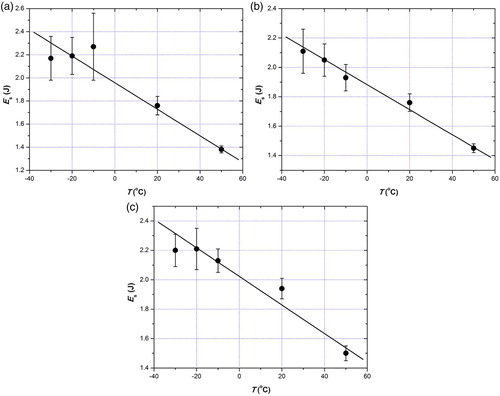
Figure 5. Pressure force acting on the anvil during the impact (F) as a function of sample deflection (d) for sample P1 at temperatures T1 = –30 °C, T2 = –20 °C, T3 = –10 °C, T4 = 20 °C and T5 = 50 °C.
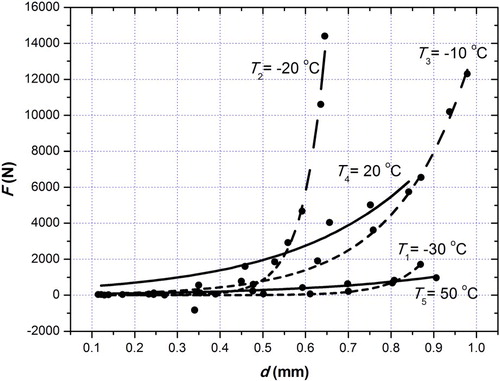
Figure 6. Pressure force acting on the anvil during the impact (F) as a function of sample deflection (d) for sample P2 at temperatures T1 = –30 °C, T2 = –20 °C, T3 = –10 °C, T4 = 20 °C and T5 = 50 °C.
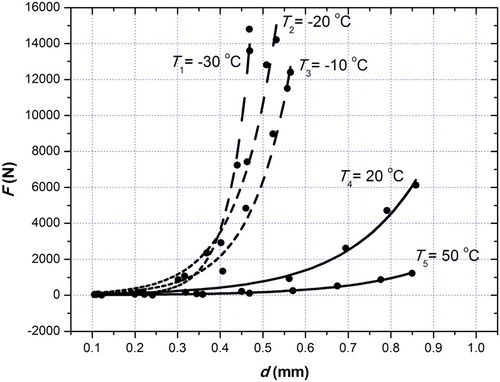
Figure 7. Pressure force acting on the anvil during the impact (F) as a function of sample deflection (d) for sample P3 at temperatures T1 = –30 °C, T2 = –20 °C, T3 = –10 °C, T4 = 20 °C and T5 = 50 °C.
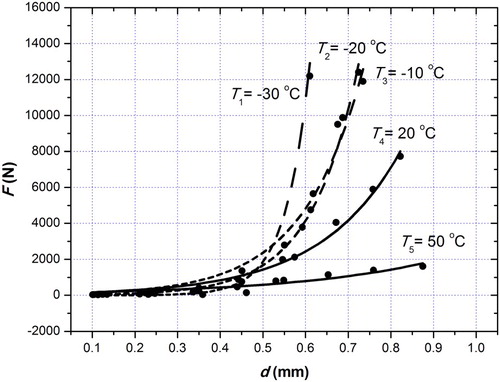
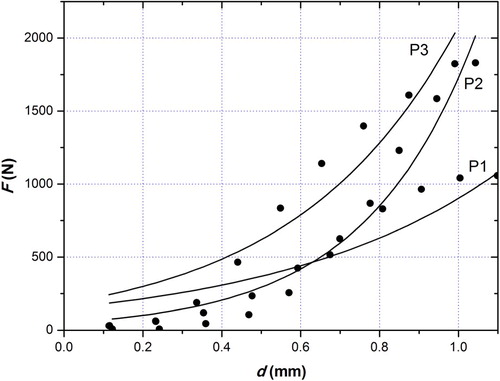
Figure 8. Pressure force acting on the anvil during the impact (F) as a function of sample deflection (d) for samples P1, P2 and P3 at temperature T1 = –30 °C.
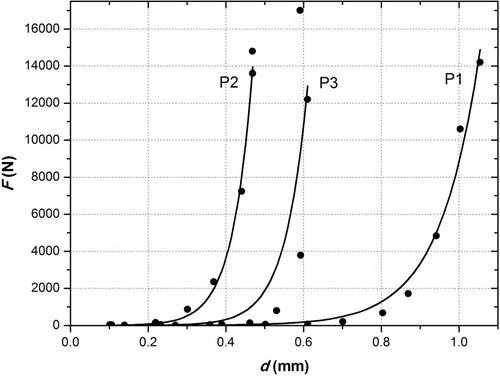
Figure 9. Pressure force acting on the anvil during the impact (F) as a function of sample deflection (d) for samples P1, P2 and P3 at temperature T2 = –20 °C.
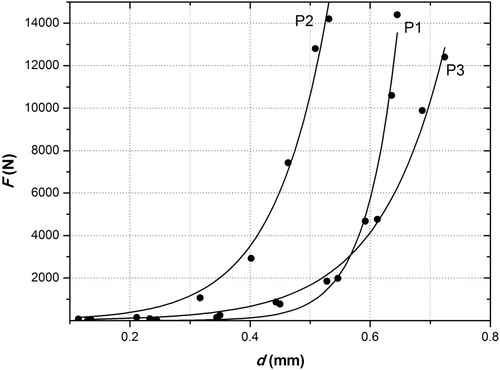
Figure 10. Pressure force acting on the anvil during the impact (F) as a function of sample deflection (d) for samples P1, P2 and P3 at temperature T3 = –10 °C.
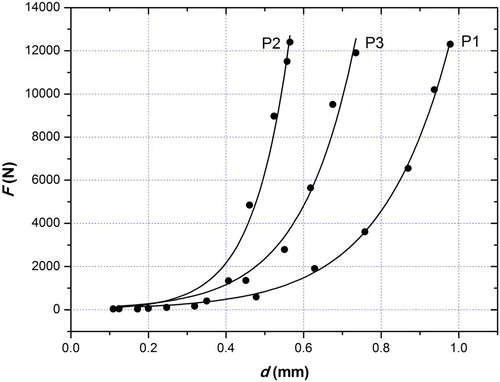
Figure 11. Pressure force acting on the anvil during the impact (F) as a function of sample deflection (d) for samples P1, P2 and P3 at temperature T4 = 20 °C.
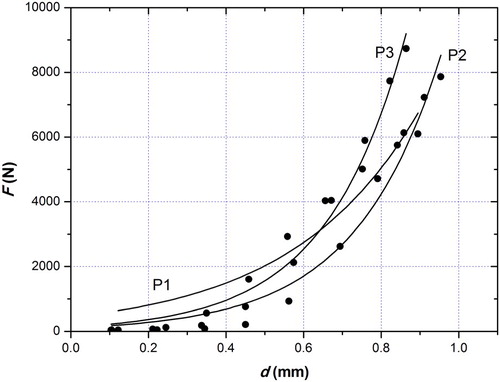
Figure 12. Pressure force acting on the anvil during the impact (F) as a function of sample deflection (d) for samples P1, P2 and P3 at temperature T5 = 50 °C.