Figures & data
Figure 1. Attention network test pattern. Note: * cue; + fixation point.
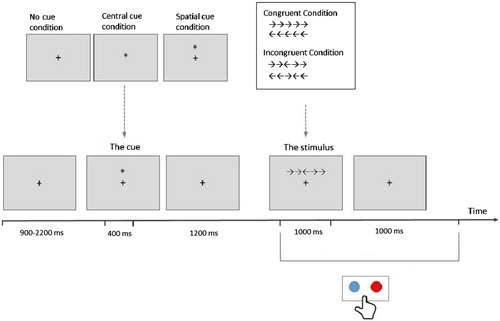
Figure 2. N-back task pattern. Note: Left button, matched stimuli; right button, non-matched stimuli.
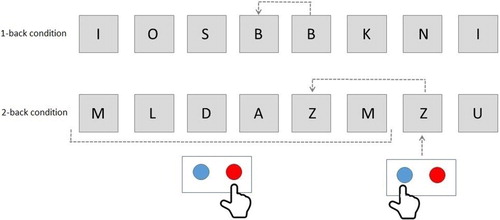
Table 1. Reaction time to a matched and non-matched stimulus in the N-back task.
Table 2. Reaction time and answer correctness for all conditions of the ANT.
Figure 3. Evoked potentials in the attention network test to proper stimuli presented in all conditions during recording on the day off in the evening. Note: The full colour version of this figure is available online. CNV = contingent negative variation. Red, paramedics; green, firefighters; blue, control group.
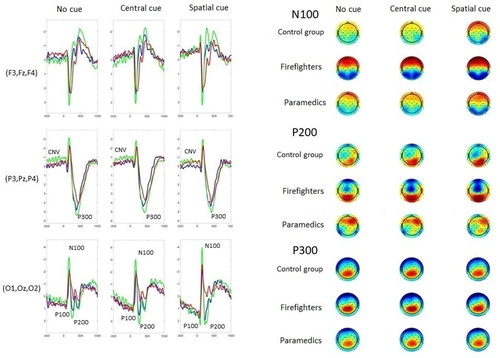
Table 3. P200 potential in the ANT on the frontal and occipital electrodes.
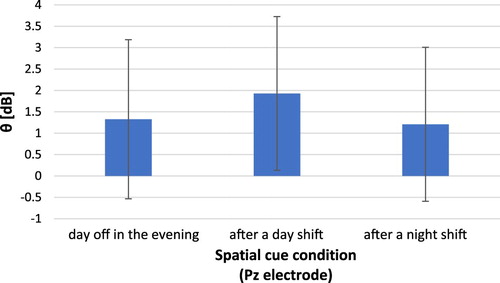
Figure 4. Relative value of power (mean and standard deviation) on the occipital electrode in the θ band in the time window of ca. 100–500 ms after presentation of the proper stimulus in the spatial cue condition in the attention network test in the group of paramedics.