Figures & data
Table 1. Characteristics of volunteers.
Table 2. Test variants.
Figure 1. Test scheme: pre-test (preparation for test); 1 h of exposure in climatic chamber; and after the test.
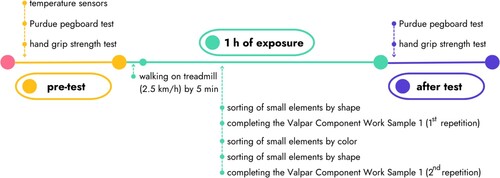
Figure 2. Mean weighted skin temperature values of volunteers before, at 20 and 40 min, and after (60 min) the test, depending on the variants. Note: bars = mean values, whiskers = standard deviation.
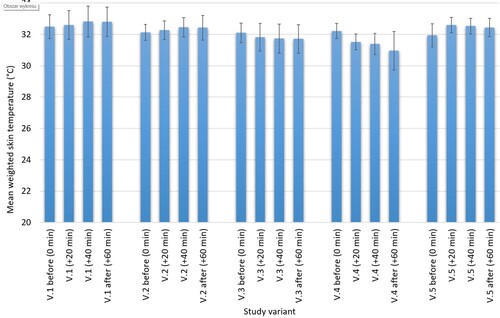
Table 3. Difference in skin temperature (skin temperature after cold exposure minus skin temperature before cold exposure) for variants V.1–V.5.
Figure 3. Mean values of skin temperature on the left hand before and after cold exposure, depending on the test variant. Note: bars = mean values, whiskers = standard deviation.
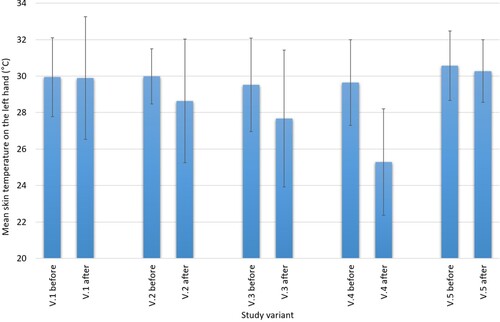
Figure 4. Mean values of skin temperature on the right hand before and after cold exposure, depending on the study variant. Note: bars = mean values, whiskers = standard deviation.
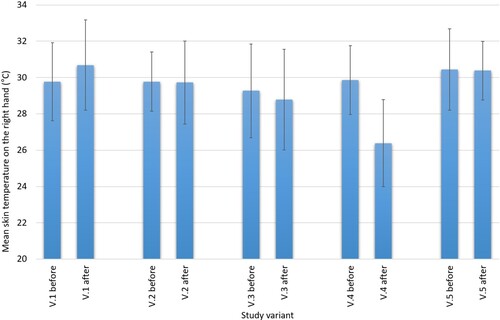
Figure 5. Mean values obtained in the Purdue pegboard test for the right hand (RH) and left hand (LH), depending on the study variant. Note: bars = mean values, number of pegs, whiskers = standard deviation.
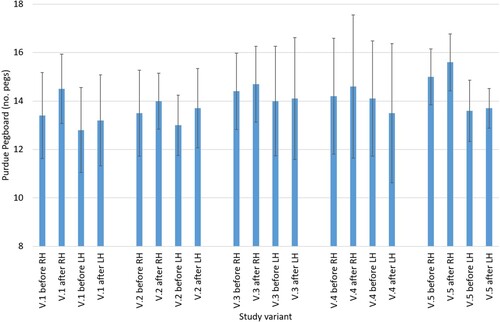
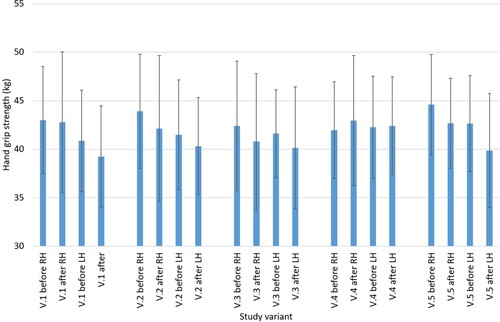
Figure 6. Mean values of grip strength for right hand (RH) and left hand (LH) for 10 volunteers depending on the study variant. Note: bars = mean values, whiskers = standard deviation.