Figures & data
Figure 1. Geographical location of Fuzhou City (a is the provincial administrative division of China, b is the location of Fuzhou city in Fujian province, and c is the elevation of the district and county administrative divisions of Fuzhou City.).
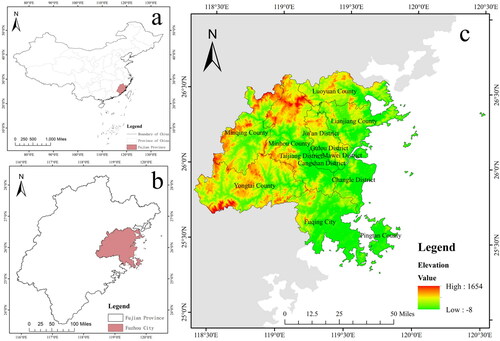
Table 1. Research data and sources.
Figure 2. Flow chart of this study.
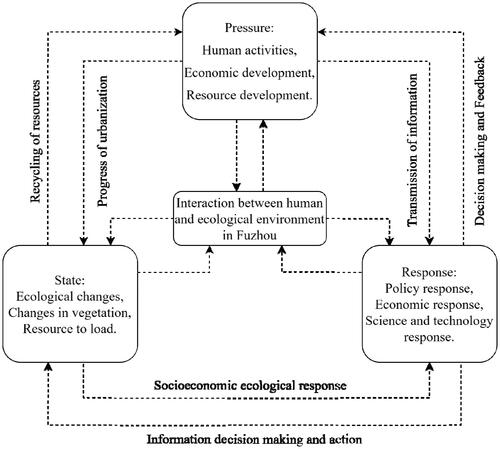
Figure 3. Ecological security analysis framework based on PSR model.
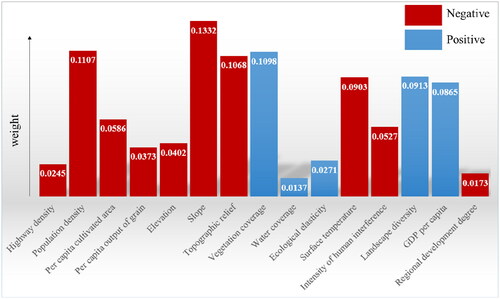
Table 2. Calculation method of PSR model index factors in Fuzhou.
Table 3. Evaluation index system of land ecological security in Fuzhou.
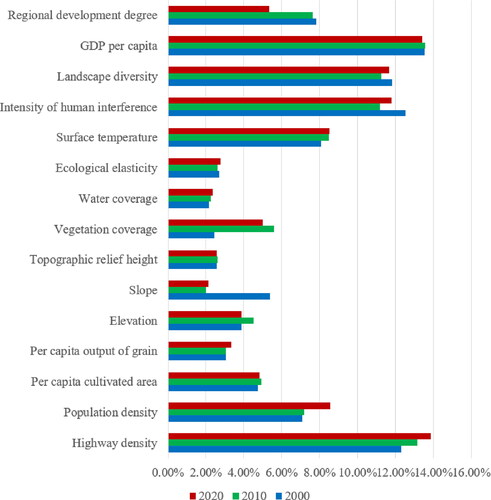
Figure 4. Factor weight and trend of ecological security index in Fuzhou.
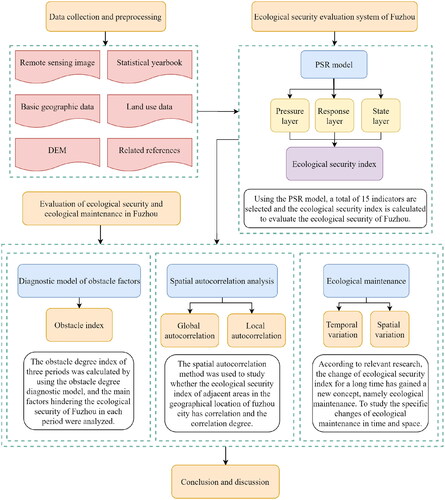
Figure 5. Spatial distribution of land use types in Fuzhou.
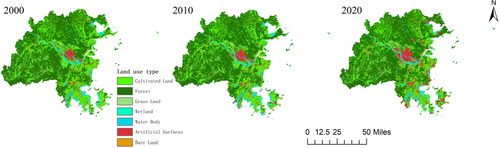
Table 4. Transfer matrix of land use type change in Fuzhou (km2).
Figure 6. Dynamic attitude of land use in Fuzhou from 2000 to 2020.
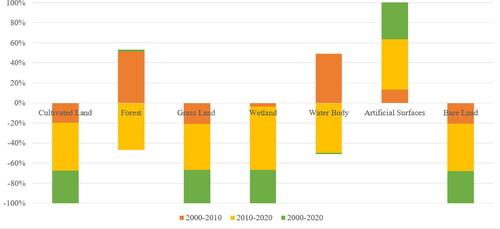
Table 5. Parameters of human interference intensity in Fuzhou.
Table 6. Ecological elasticity score of Fuzhou city.
Figure 7. Spatial distribution of ecological security index of Fuzhou.
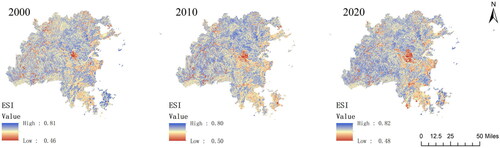
Figure 8. Spatial distribution of ecological maintenance in Fuzhou.
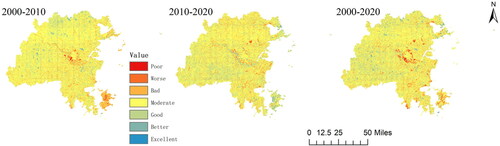
Figure 9. Area statistics of ecological maintenance degree in Fuzhou. (The three time periods are, from left to right: 2000 to 2010, 2010 to 2020 and 2000 to 2020.).
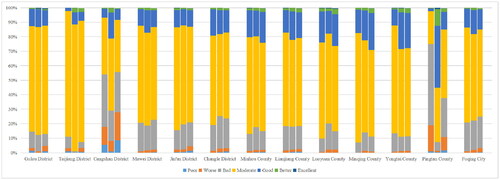
Table 7. Spatial correlation test results of ecological security index in Fuzhou.
Figure 10. Moran Scatter plot of Fuzhou.
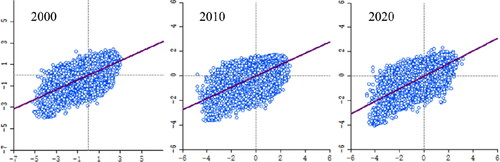
Figure 11. Spatial aggregation of ecological security index in Fuzhou.
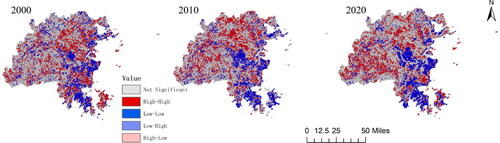
Figure 12. Obstacle degree of ecological security evaluation index in Fuzhou.