
Figures & data
Figure 1. Diagram of proposed mechanism of transport and metabolism for the fate of pyrethroid metabolites detected in saliva using permethrin as an example.
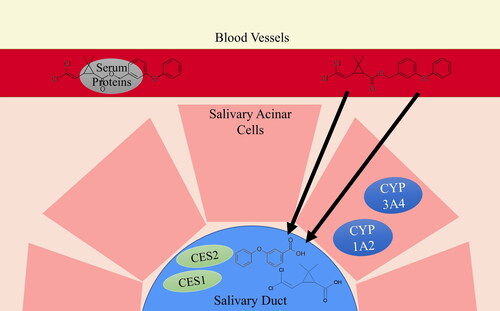
Figure 2. Six pyrethroid metabolites commonly used in biological monitoring studies as analytes of interest for detection in saliva.
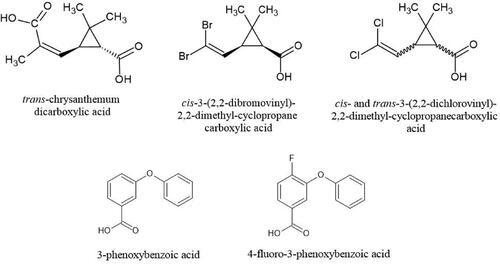
Table 1. Recoveries (%) for liquid-liquid extraction (LLE) method development of 100 ng/mL six pyrethroid metabolite mixture spiked in saliva, comparing mixing speed and extraction solvent.
Figure 3. Two saliva collection devices tested for this study: (A) SalivaBio® sample collection aide attached to 2 mL cryovial, and (B) salivette® sample collection device showing cotton swab and cap separate from collection device.
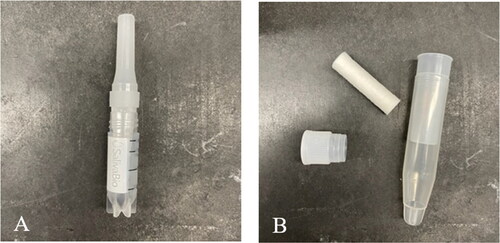
Table 2. Retention time (RT), quantification (Q) ions and confirmation ions of six pyrethroid metabolites and three internal standards using gas chromatography – ion trap mass spectrometry in select ion storage mode.
Table 3. Questionnaire data including demographic information, occupational history, occupational and non-occupational exposures, and metabolic interferences of the study population.
Table 4. Intra-day (n = 7) and inter-day (n = 5) variation (%) of saliva methodology, limit of detection (LOD) (ng/mL) and detection frequencies (%) for six pyrethroid metabolites analyzed in pre-work (n = 9) and post-work (n = 8) saliva and pre-work (n = 9) and post-work urine (n = 9) of nine pest control operators before and after a full day of work.
Table 5. Mean concentrations (ng/mL) of six pyrethroid metabolites in pre- and post-work urine samples of nine pest control operators.
Figure 4. Comparison of mass spectra for 3PBA detected in (A) a pest control operator (PCO) saliva sample and (B) 10 ppb 3PBA-spiked saliva sample. Both spectra exhibit characteristic quantitation ions, 364 m/z and 169 m/z, and similar retention times.
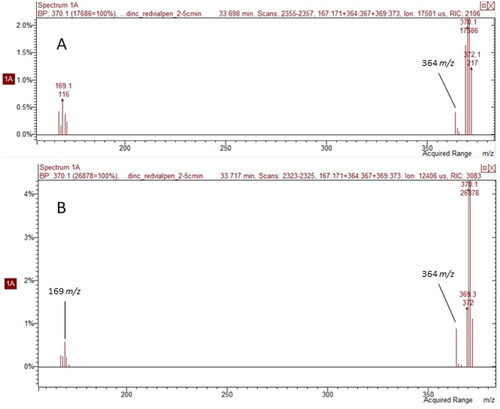
Table 6. Biomonitoring studies assessing pesticide levels in saliva, population characteristics, methodology, and sample analysis.