Figures & data
Table 1. Demographic characteristics of the study sample
Table 2. Knowledge questions, correct answer, and percentage of participants answering correctly
Figure 1 Distribution of scores for advanced maternal age (AMA), assisted reproductive technologies (ART), and total knowledge score (TKS).
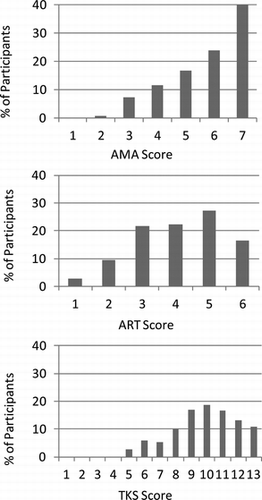
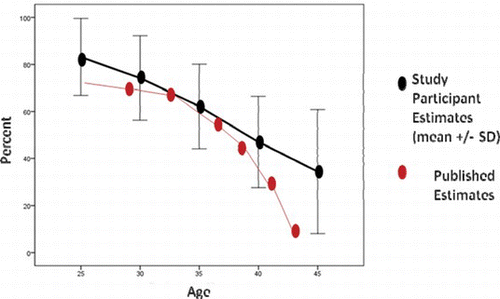
Figure 2 Participants' estimates of probability of spontaneous pregnancy at different ages (M ± 1 SD). (Color figure available online.)
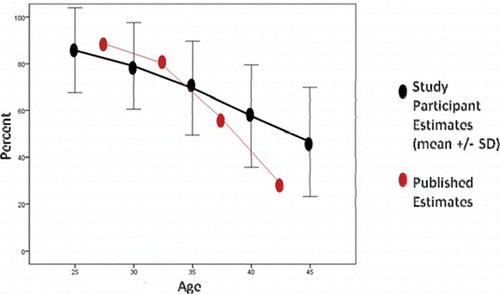
Figure 3 Participants' estimates of probability of pregnancy after ART at different ages (M ± 1 SD). ART = assisted reproductive technologies. (Color figure available online.)