Figures & data
Fig. 1 The three stoves used in the study: an M-5000 wood burning rocket stove, a CH-2200 charcoal burning stove, and a larger CH-5200 charcoal burning stove. © Envirofit, 2014. Reproduced by permission of Envirofit. Permission to reuse must be obtained from the rightsholder.
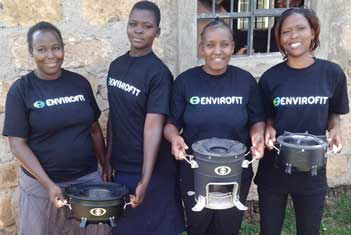
Fig. 2 Flow of selection, screening, and randomization for the study.
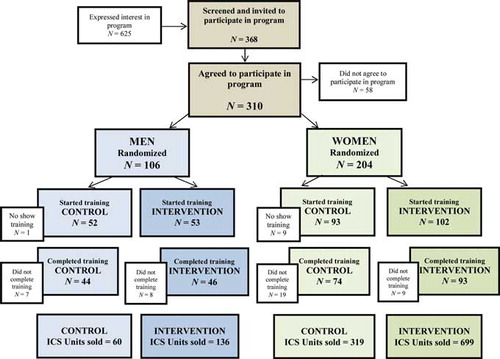
Table 1. Baseline characteristics of randomized sample (n =300 )
Table 2. Median (and range) improved cookstove sales for the duration of the study, by gender and intervention
Fig. 3 Percentage of cookstove sellers, by type, gender, and intervention.
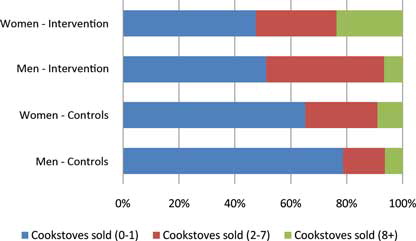
Fig. 4 Kaplan-Meier curve showing business survival (activity) rates over time between control and intervention groups. Statistical significance χ2 df; Log-rank 16.23; p < .0004.
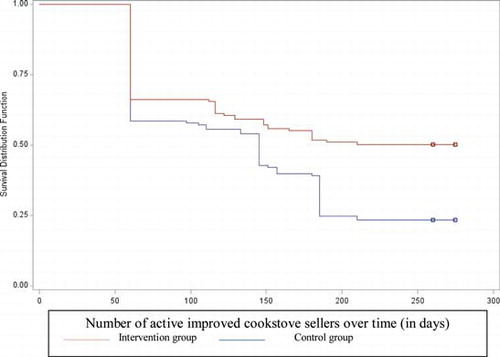
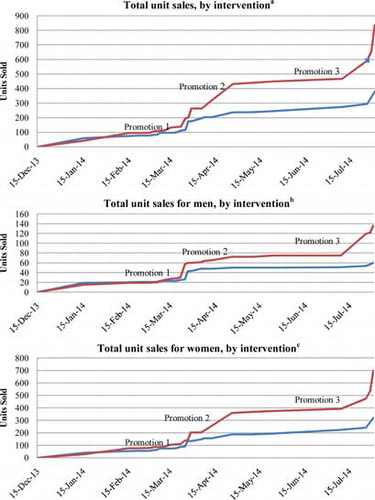
Fig. 5 Total cookstove sales over time, by intervention group. aIntervention n = 835, control n = 379. bIntervention men n = 136, control men n = 60. cIntervention women n = 699, control women n = 319.