Figures & data
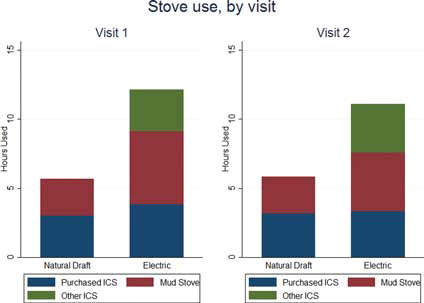
Fig. 1 (A) Promotional pamphlet in Hindi for Pilots F and G showing the traditional stove, natural-draft stove, and an electric stove, with (B) English translations.
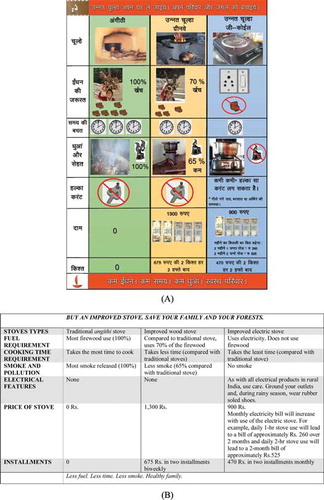
Table 1. Summary of pilot intervention features
Table 2. Characteristics of pilot villages, by village (Pilots C–H)
Fig. 2 Stove purchase, by randomly selected households. One household in Pilot G that purchased an electric stove also purchased a natural-draft stove.
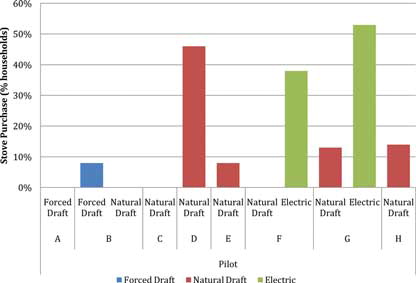
Table 3. Test for differences in means between purchases and nonpurchasers for randomly selected households (Pilots C–H)
Fig. 3 Two attributes considered best (A; n = 84) and worst (B; n = 88) about the improved cookstoves (ICS), by randomly selected households (Pilots C–H) on average (with 95% confidence intervals).
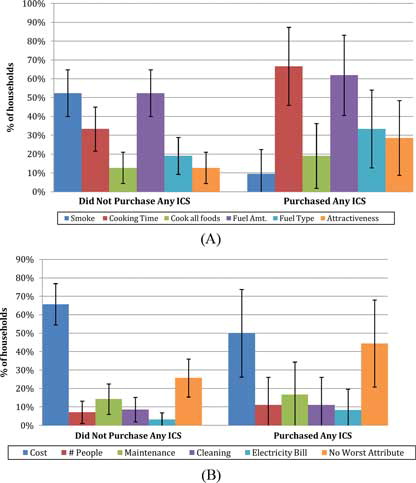
Fig. 4 Purchases among randomly selected households grouped by (A) intensity of promotion campaign and (B) payment plan in the village; (n = 26 purchasers) across all pilots.
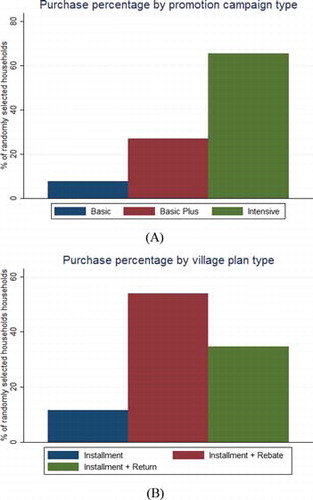
Fig. 5 Stove use in the past 24 hours checked at visit 1 (2 weeks after purchase) and visit 2 (1 month after purchase). Visit 1 and 2, n = 35; data from Pilots D–H. If households responded that both traditional and improved cookstoves (ICSs) were used, the time was divided between the two stoves as estimated by the household.