
Figures & data
Figure 1. Coverage intensity (number of online stories published) of the Ebola epidemic through online media from 1 July 2014 to 17 November 2014. (Source: Authors’ analysis of coverage intensity for keyword “Ebola” 2015.)
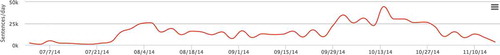
Table 1. Top 10 media sources online ranked by quantity of inlinks from 1 July 2014 to 17 November 2014
Table 2. Top 10 media stories online ranked by quantity of inlinks from 1 July 2014 to 17 November 2014
Table 3. Summary of color-coded communities within the visualization maps shown in and
Figure 2. Network map of the five communities identified by the content clustering analysis that shared common language and phrasing during the Ebola epidemic, with example sources labeled. (Source: Authors’ content clustering analysis of communities and keywords, 2015.)
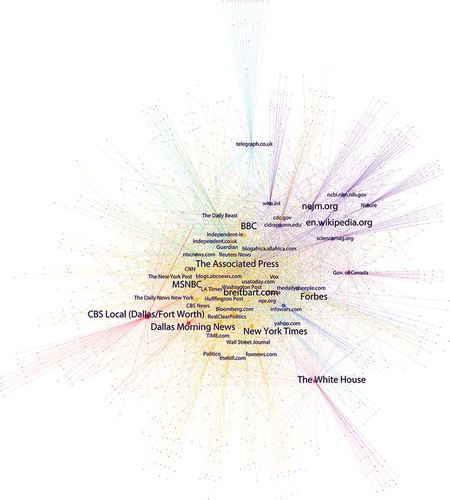
Figure 3. Network map of the five communities identified by the content clustering analysis that shared common language and phrasing during the Ebola epidemic, displaying examples of the most common words used in published text. (Source: Authors’ content clustering analysis of communities and keywords, 2015.)
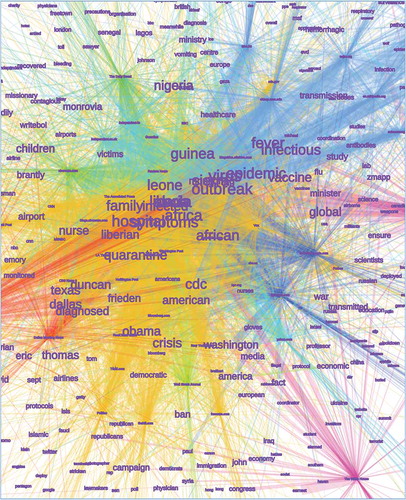
Table 4. Top 10 stories by Twitter shares and Bitly clicks 1 July 2014 to 17 November 2014
