
Figures & data
Table 1. Percent of tweets from various PA cities
Table 2. Percent of tweets from various PA counties
Figure 1. COVID-19 communication analysis pipeline.

Table 3. Categories for BEND maneuvers
Figure 2. Distribution of PA tweets over time.
Figure 3. Distribution of PA tweets between bots (red) and not bots (blue) over time.
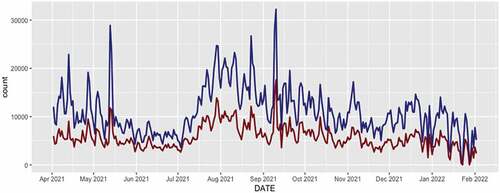
Figure 4. Distribution of PA tweets between actors propagating negative stance narratives (red) and positive stance narratives (green) over time.
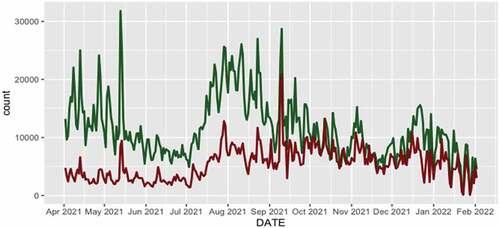
Figure 5. All-communication network for users shows the prevalence of positive stance users (green agents) over negative stance users (red agents).
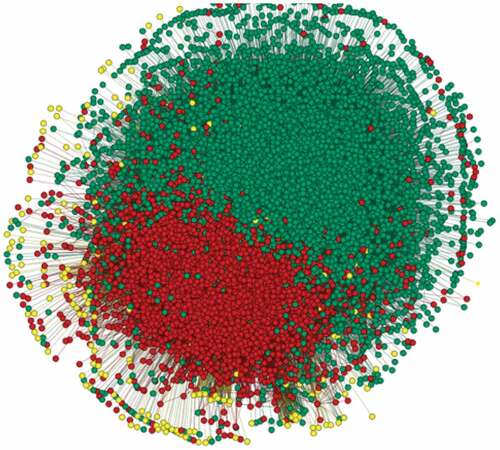
Figure 6. Number of documents per BEND category.
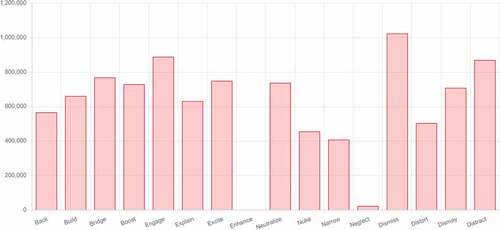
Table 4. Examples for dismiss, distract, distort, and dismay
Table 5. Examples for explain, enhance, excite, and engage
Table 6. Examples of neutralize, nuke, narrow, and neglect
Table 7. Examples for build, back, boost, and bridge
