
Figures & data
Table 1. Percentage of sample by demographics by panel wave (unweighted)
Table 2. Measures of knowledge, wave of assessment, and truth status
Figure 1. Estimates of COVID-19 primary series vaccination by racial-ethnic identity: (a) as measured by the ASAPH panel; and (b) as reported by CDC administrative data (CDC, Citation2023).
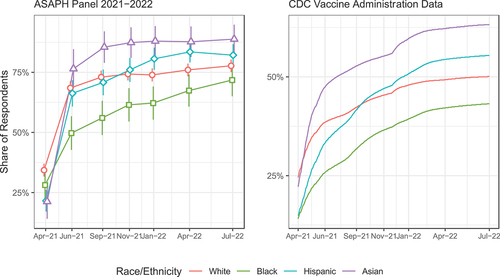
Table 3. Percentage of respondents knowing someone who died as a result of COVID-19 with significant differences compared to non-Hispanic White respondents by racial-ethnic group and wave
Table 4. Reported trust in the Centers for Disease Control and Prevention (CDC) by wave and racial-ethnic group (1–4 scale)
Figure 2. Knowledge scores by race-ethnicity and wave.
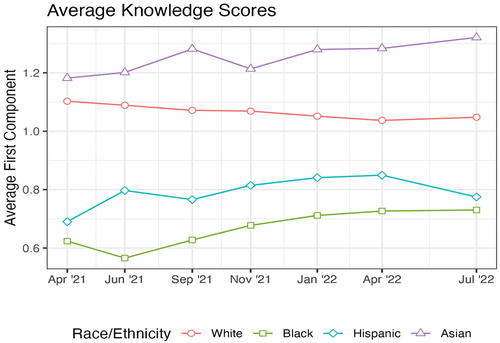
Table 5. Means for media use by racial-ethnic groups with significant differences from White respondents (0 to 4 scale)
Table 6. Percentage reporting availability of COVID-19 vaccination across the first four waves among those still not vaccinated at each wave with significant differences from White respondents
Figure 3. Structural model of standardized weights for factors underlying changes in vaccination between Black and White respondents over time.
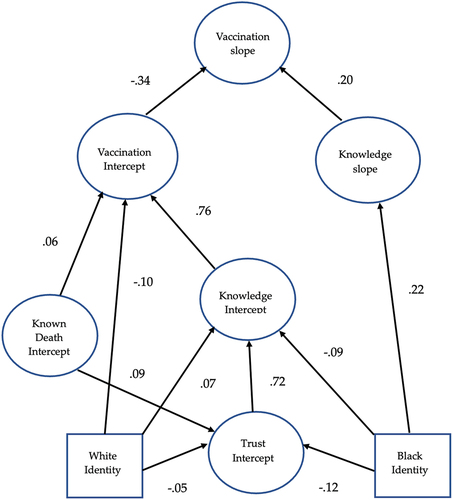
Table 7. Direct predictors of latent variables in Figure 3 with 99% confidence intervals
Table 8. Correlations between racial-ethnic groups and variables in the model that exceeded 99% confidence intervals