
Figures & data
Table 1. Socio-demographics characteristics of participants
Table 2. Mean comparisons between individuals exposed to the message and those who were not
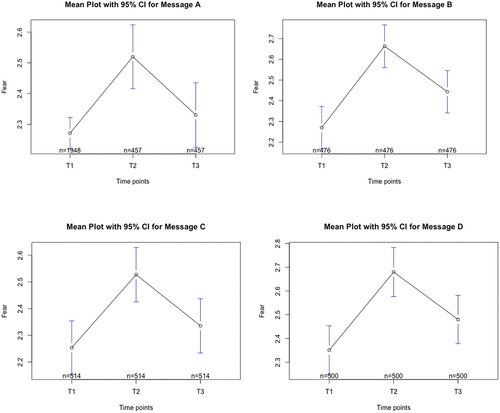
Figure 1. Dynamic fear responses among four message groups.
T1 represents baseline fear, measured before participants were exposed to any message. T2 captures peak fear, measured after participants viewed the threat portion of the message. T3 refers to end fear, measured after participants completed viewing the entire fear appeal message. Participants in all four message conditions produced fear responses that first rose and then fell.
Supplemental material