
Figures & data
Table 1. Descriptive statistics of the study sample (n = 4,109) for survey waves 1–4 (January 2021-March 2022) among U.S. Adults
Table 2. Cumulative campaign digital impressions and vaccination belief scales
Figure 1. Predictive Margins of the Vaccination Belief Scales.
95% confidence intervals and predicted probabilities at means and 1 million cumulative Campaign digital impressions (within 2 standard deviations).
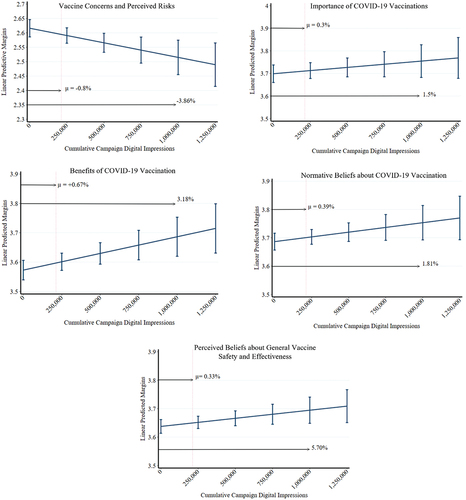
Table 3. Main results of vaccination belief scales that were less focal to the campaign during the study period (January 2021–March 2022)
Supplemental material