Figures & data
Table 1. Absolute and relative frequencies according to socio-economic and occupational strata of the woman at onset of risk for the first child
Figure 1. Total fertility rate (TFR) 1900–1963 in the POPLINK-sample from Västerbotten and in Sweden 1900–70.
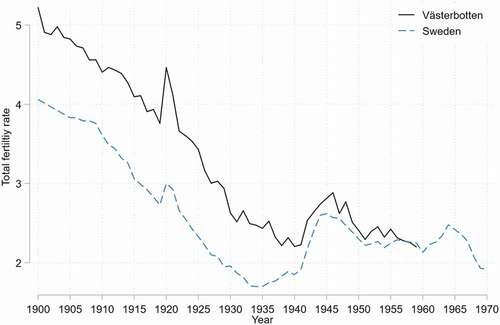
Figure 2. Relative distribution of socio-economic strata by risk cohorts (year reaching age 20) 1900–59 for Swedish women in Västerbotten county.
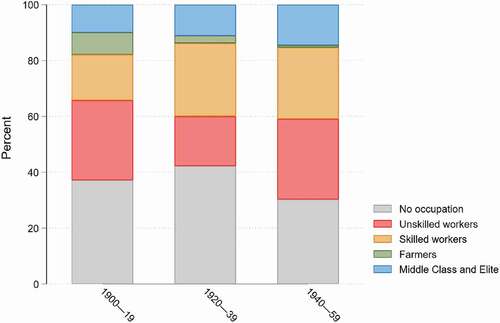
Figure 3. Kaplan-Meier estimates of the proportion not having experienced first, second and third birth as function of the woman’s age by socio-economic strata and at-risk cohort (year reaching age 20) 1900–59.
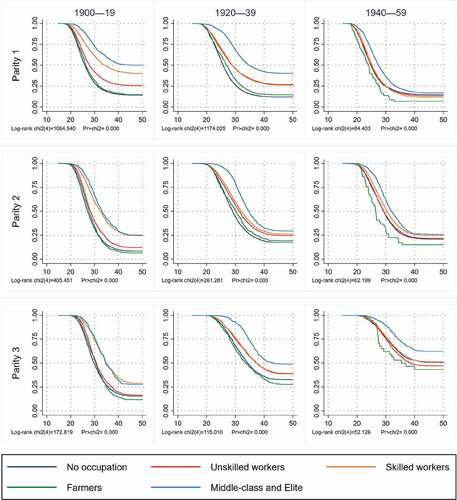
Figure 4. Kaplan-Meier estimates of the proportion not having experienced first birth as a function of the woman’s age in different female middle-class occupations compared to non-employed women by risk cohorts (year reaching age 20) 1900–59.
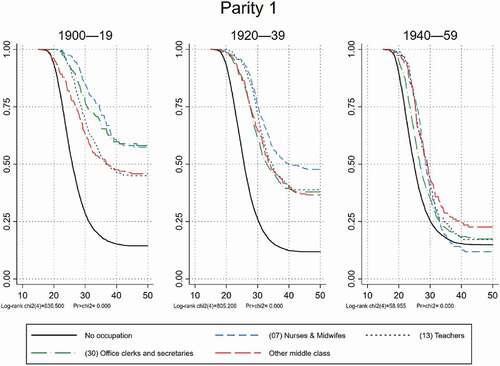
Figure 5. Kaplan-Meier estimates of the proportion not having experienced second birth as a function of the woman’s age in different female middle-class occupations compared to non-employed women by risk cohorts (year reaching age 20) 1900–59.
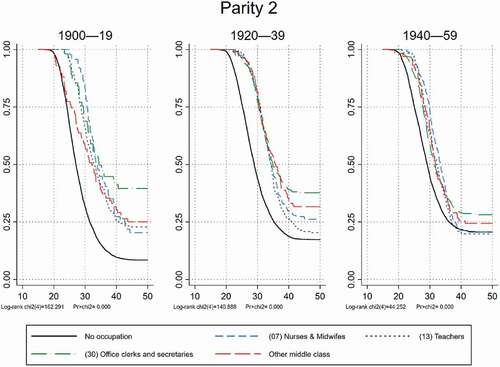
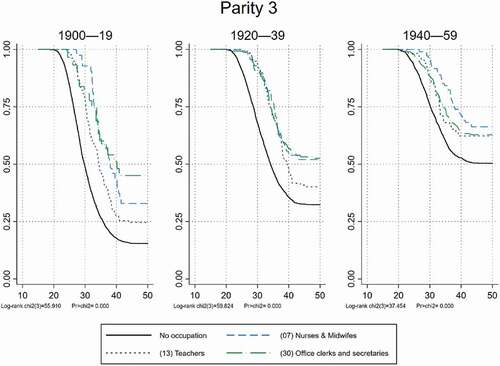
Figure 6. Kaplan-Meier estimates of the proportion not having experienced a third birth as a function of the woman’s age in different female middle-class occupations compared to non-employed women by risk cohorts (year reaching age 20) 1900–59.