Figures & data
Figure 1. Map of Beijing’s first health district and Qinghe district, 1936.
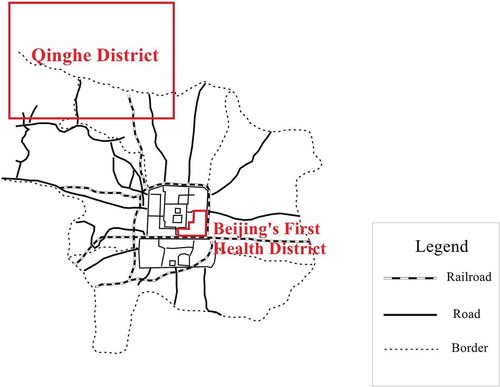
Figure 2. Percentage of infants delivered by different birth attendants in Beijing’s first health district, 1926–1937.
Table 1. Percentage of infants delivered by different birth attendants in Beijing’s first health district (1932–1937) and Beijing’s all districts (1934).
Table 2. Neonatal mortality rate and birth attendants in Beijing’s first health district, 1932, 1933, 1934, 1935 and 1937 (categorized in four groups).
Table 3. Neonatal mortality rate and birth attendants in Beijing’s first health district, 1932, 1933, 1934, 1935 and 1937 (categorized in two groups).
Table 4. Neonatal mortality rate and birth attendants in Beijing’s first health district (categorized by the causes of death), 1932–1935.
Figure 3. IMR of Beijing’s first health district, Qinghe town and Beijing (all districts), 1926–1938.
Figure 4. MMR of Beijing’s first health district and Beijing (all districts), 1926–1938.