
Figures & data
Figure 1. Familial factors associated with offspring survival and their demographic indicators.
Figure 2. Data and variable selection.
Table 1. Characteristics of parents and offspring in the studied sample of LINKS Zeeland.
Figure 3. Cumulative hazard (a) and survival plot (b) of the association between having a top 10% surviving parent and offspring survival between ages 5–100.
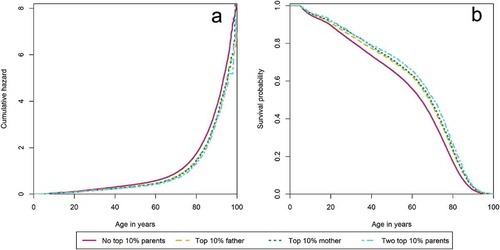
Table 2. Overview of estimated Cox models.
Table 3. Association between parental longevity and offspring survival between ages 5–100.
Table 4. Full model (5) of the significant associations between familial resources and offspring survival between ages 5–100.
Figure 4. Cumulative hazard (a) and survival plot (b) of the association between having a top 10% surviving parent and offspring survival between ages 0–5.
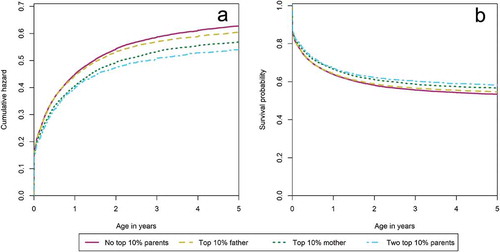
Table 5. Association between parental longevity and offspring survival between ages 0–5.
Table 6. Full model (6) of the significant associations between familial resources and offspring survival between ages 0–5.
Top 10% survivors as defined by the Swedish cohort life tables.
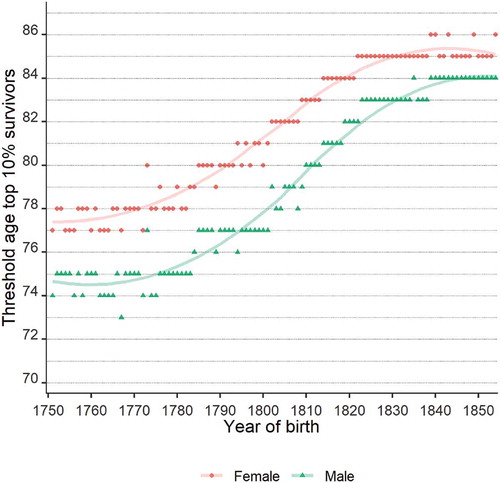
Figure A2. Visualization of disjoint family selection.
Table A1. Separate model associations between familial resources and offspring survival between ages 5–100, full table.
Table A2. Separate model associations between familial resources and offspring survival between ages 0–5, full table.
Table A3. Separate model associations between parental longevity and offspring survival between ages 5–100, robustness checks.
Table A4. Separate model associations between parental longevity and offspring survival between ages 0–5, robustness checks.
Table A5. Full model (5) Association between having a top 10% parent and offspring survival for offspring who did not lose a parent before age 5, between ages 5–100.
Table A6. Full model (6) associations between having a top 10% parent and offspring survival for offspring who did not lose a parent before age 5, between ages 0–5.
Table A7. Association between birth spacing and offspring survival for small (2–3) and large (9+) sibships between ages 0–5 in the full model (5).