
Figures & data
Table 1. Descriptive statistics for the Patriarchy Index and its components for 316 regional populations of Europe (NAPP/Mosaic combined).
Figure 1. Patriarchy Index in the NAPP/Mosaic dataset (316 regions).
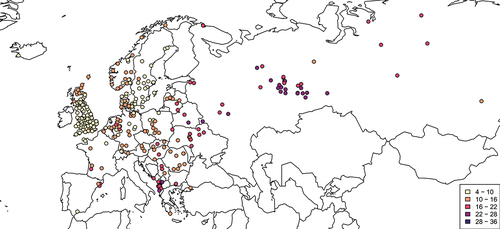
Figure 2. Child sex ratios in the NAPP/Mosaic dataset (316 regions).
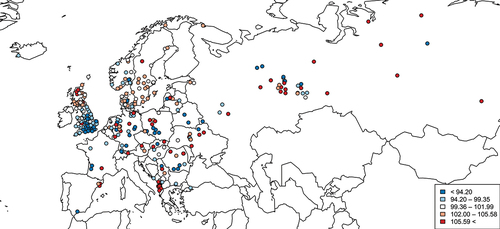
Figure 3. Patriarchy Index and child sex ratios in the NAPP/Mosaic dataset (316 regions).
Table 2. Patriarchy Index and child sex ratios.
Table 3. Patriarchy Index and child sex ratios, restricted samples.
Table 4. Dimensions of patriarchy and child sex ratios.
Table 5. Components of the Patriarchy Index and child sex ratios.
Table A1. Descriptive statistics.
Table A2. Patriarchy and child sex ratios (full model results).
Table A3. No prior weights (excluding locations with less than 1,000 children).
Table A4. Quasibinomial model (accounting for overdispersion).
Table A5. Spatial autocorrelation. Moran’s Eigenvectors.
Table A6. The components of the PI and child sex ratios (different ages).