Figures & data
Figure 1. Sex ratio at birth (number of male live births per 100 female) in Denmark 1840–1900 calculated by decade.
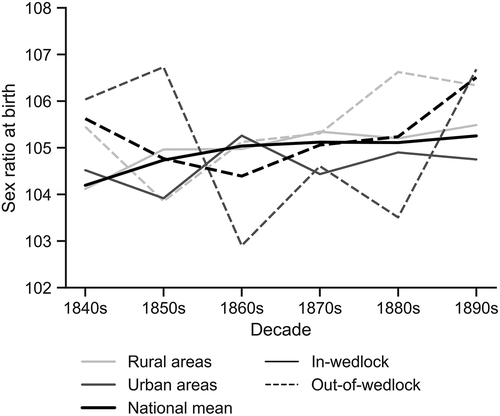
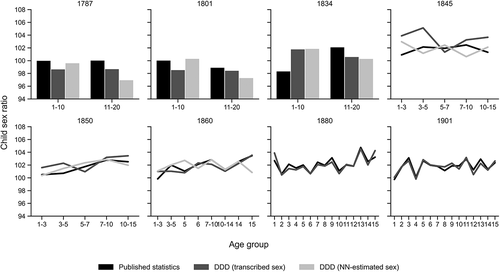
Figure 2. Child sex ratios (number of males per 100 females) in Denmark in different age groups in the eight censuses from 1787 to 1901. The dotted line shows the very rough estimate of a ‘neutral’ sex ratio at 101.5. The Danish Demographic Database and the Link-Lives project.
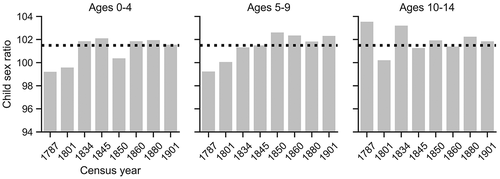
Table 1. Descriptive statistics for the child sex ratio (ages 0–9) calculated for each of the Danish counties in the eight censuses from 1787 to 1901. Source: The Danish Demographic Database and the Link-Lives project.
Figure 3. Child sex ratios in the eight Danish censuses, calculated for four age groups and for rural and urban parishes separately.The Danish Demographic Database and the Link-Lives project.
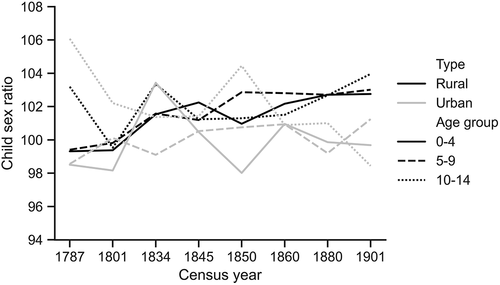
Figure 4. The male mortality rate (deaths per 10,000) as a percentage of the female rate, by period and age group 1840–1940. The year ranges reflect that the data was published by decade from 1840–1900, and for five year ranges from 1900–1940.
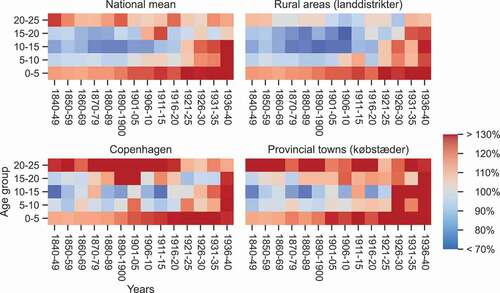
Figure 5. Mortality rate (deaths per 10,000) by sex, age group, period and for rural and urban areas and the city of Copenhagen separately. The year ranges reflect that the data was published by decade from 1840–1900, and for five year ranges from 1900–1940.
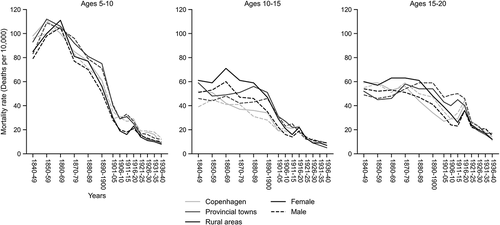
Figure 6. The male mortality rate (deaths per 10,000) as a percentage of the female rate, by period and age 1860–1900, for Copenhagen and rural areas separately. The year ranges reflect that the data was published by decade from 1860–90, and for five year ranges from 1890–1900.
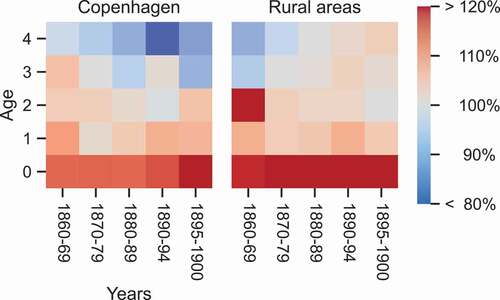
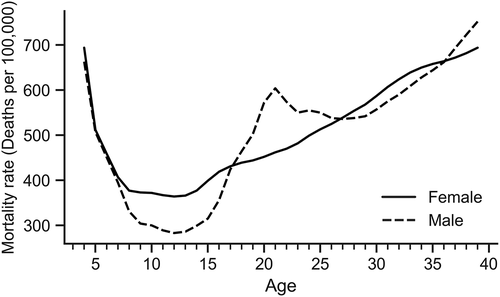
Figure 7. Mortality rate (deaths per 100,000) by sex and age in Denmark 1895–1900.