Figures & data
Table 1. The design approach and experimental result of response surface methodology.
Figure 1. Aqueous two-phase (ATPE) diagram of ammonium ethanol sulfate.
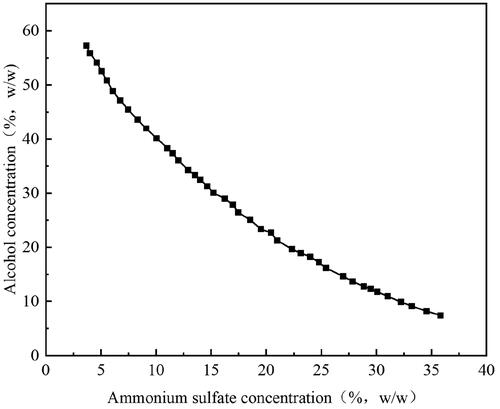
Figure 2. The effects of six factors on the recovery (Y) and partition coeffificient (K) of mulberry anthocyanin. (A) Concentration of ethanol, (B) concentration of ammonium sulfate, (C) liquid-to-solid ratio, (D) microwave power, (E) microwave temperature, and (F) microwave time.
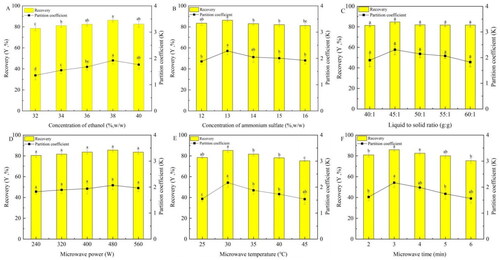
Table 2. ANOVA of the mulberry anthocyanin recovery test.
Figure 3. Response surface analysis for the extraction variables on the recovery. (A) Recovery versus ethanol concentration and ammonium sulfate concentration, (B) recovery versus ethanol concentration and microwave temperature, (C) recovery versus ethanol concentration and microwave time, (D) recovery versus ammonium sulfate concentration and microwave temperature, (E) recovery versus ammonium sulfate concentration and microwave time, and (F) recovery versus microwave temperature and microwave time.
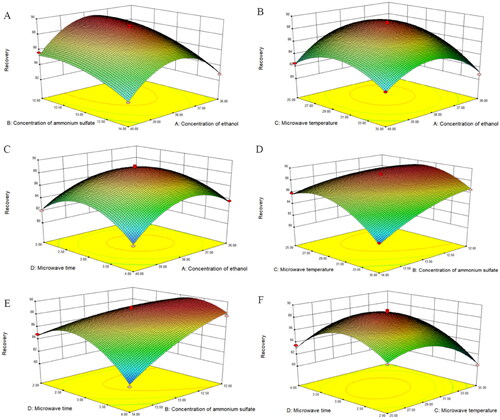
Figure 4. HPLC chromatograms of mulberry anthocyanins: cyanidin-3-O-glucoside, before MAATPE and after MAATPE.
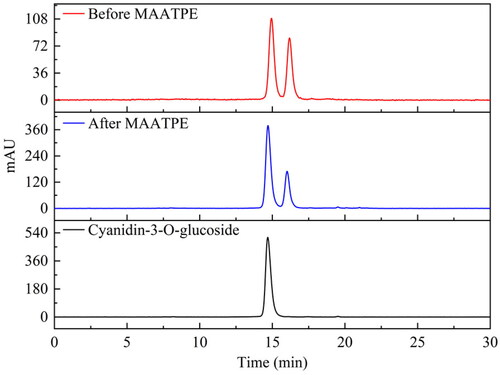
Figure 5. FT-IR spectra of before and after MAATPE extract.
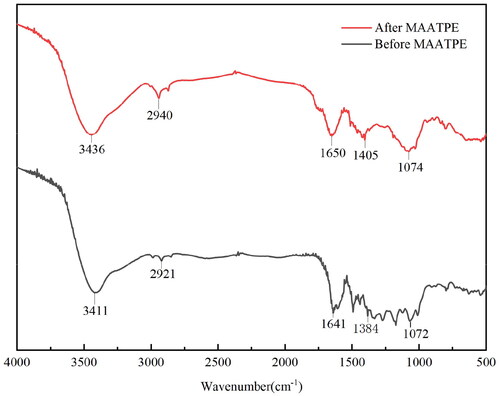
Figure 6. The scanning electron micrograph demonstrates the impact of various treatments on the mulberry’s surface microstructure: (A) mullberry powder; (B) MAE extraction; (C) ATPE extraction; and (D) MAATPE extraction.
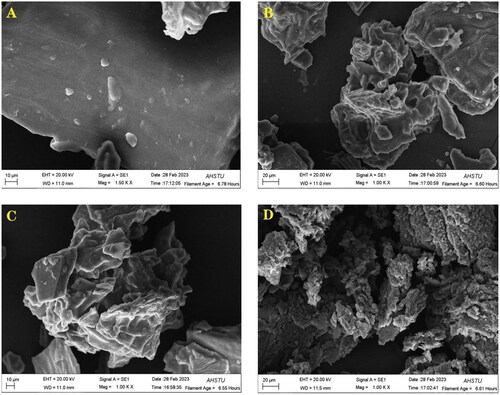
Figure 7. Scavenging effects of mulberry extracts on DPPH radicals.
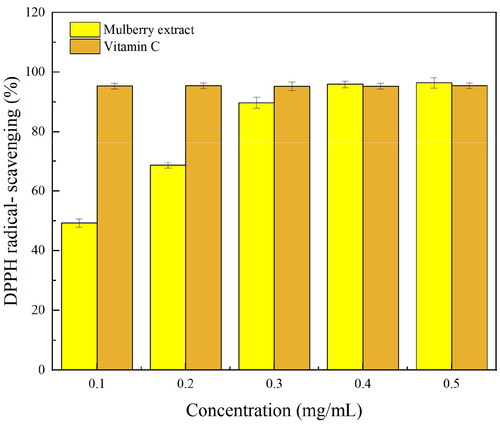
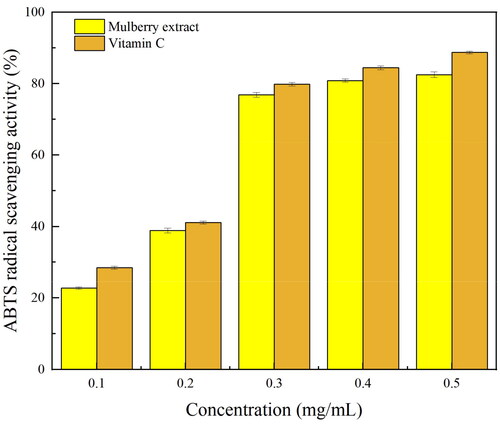
Figure 8. Scavenging effects of mulberry extracts on ABTS radicals.