
Figures & data
Figure 1. Competing measurement models of the Coping Questionnaire.
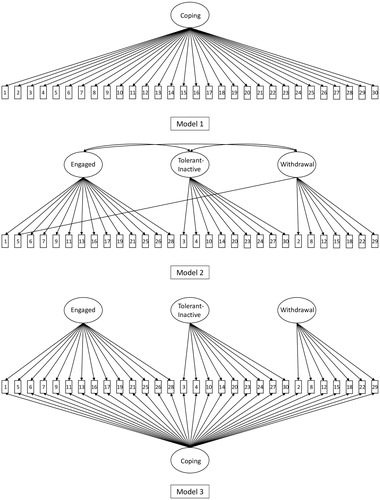
Table 1. Socio-demographic characteristics of the affected family members in the different samples.
Table 2. Degree of model fit of the three measurement models in England and Italy.
Table 3. Standardized factor loadings and reliability indices of the bifactor model.
Table 4. Standardized regression coefficients of the covariates predicting the coping factors (MIMIC-model, Model 3).
Supplemental material