Figures & data
Table A1. Alcohol Prevention Magnitude Measure: categories, indicators, cutoff and points.
Table 1. Indicators of alcohol consumption and alcohol-related harm.
Table 2. Socioeconomic characteristics among municipalities in the study and all municipalities in Sweden, 2014.
Table 3. Prevention, consumption and harm indicators among municipalities in the study and all municipalities in Sweden, 2014.
Figure 1. Trends in prevention (N = 207), consumption (N = 182), and harm (N = 207) indicators among municipalities in the study, 2006–2014.
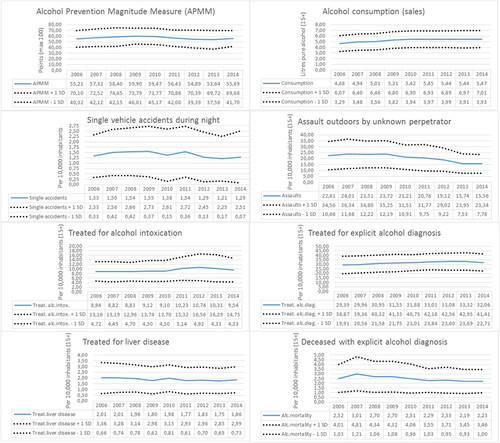
Table 4. Estimated prevention effects (weighted prevention index, WAPMM, direct and one-year lag prevention effect combined) on indicators of consumption and alcohol-related harm in percent, 2006–2014, controlled for population size, median income, unemployment, and post-secondary education.
Table A2. Estimated prevention effects (direct effect) on indicators of consumption and alcohol-related harm in percent, for 2006–2014, controlled for population size, median income, unemployment, and post-secondary education.
Table A3. Estimated prevention effects (one-year lagged effect) on indicators of consumption and alcohol-related harm in percent, for 2006–2014, controlled for population size, median income, unemployment, and post-secondary education.
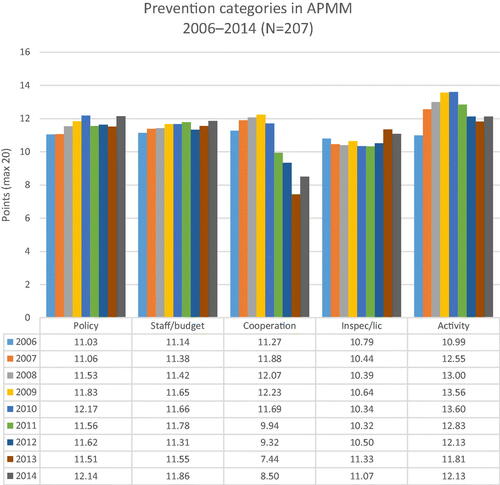
Figure A1. Prevention categories within APMM. Average points based on 207 municipalities, 2006–2014.