
Figures & data
Figure 1. Number of trained employees within the Clubs against Drugs program.
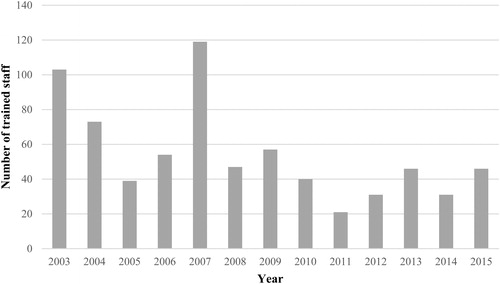
Table 1. Demographic comparisons between the samples.
Table 2. Rates of reported lifetime drug use and last year drug use, by age.
Table 3. Comparisons between last year drug users and non-drug users, attitudes and observations.
Table 4. Comparisons regarding attitudes and behavioral intentions among employees at different types of licensed premises (percentage distribution).
Table 5. Comparisons regarding illicit drug use (lifetime and last year) among employees at different types of licensed premises (percentage distribution).
Table 6. Comparisons over time, attitudes and behavioral intentions among employees (percentage distribution).
Table 7. Comparisons over time, proportion (%) of employees reporting lifetime use of illicit drugs (and by substance).