
Figures & data
Table 1 Moos’ (Citation2008) important components of a 12-step recovery group based on four key theories in addiction.
Table 2. Demographics characteristics of the three group types.
Figure 1. A bar graph showing mean ‘importance’ scores for all 12 components. Error bars represent 95% confidence intervals.
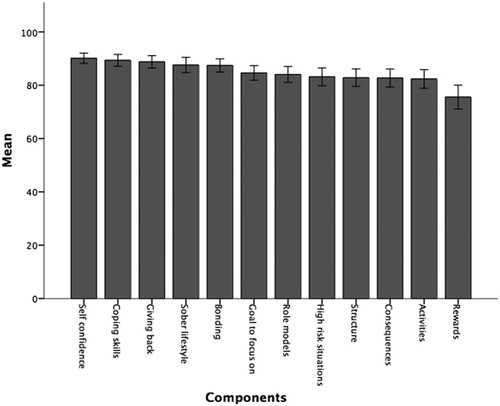
Figure 2. A bar graph showing mean ‘offered’ scores for all 12 components. Error bars represent 95% confidence intervals.
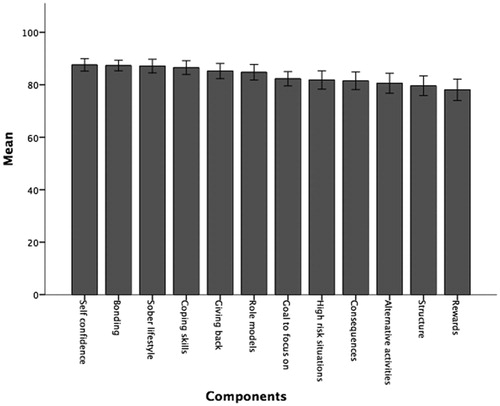
Table 3. Paired-sample t-tests showing differences between ‘offered’ and ‘importance’ ratings for each component.
Table 4. The 14 important components of addiction recovery groups.