Figures & data
Table 1. Descriptive demographic data and proportions of respondents from each country choosing each usual drinking location and usual drink type.
Figure 1. Comparison of alcohol (in gm) needed to feel the effect and whether the preferred drinking location is within or outside of the home by country.
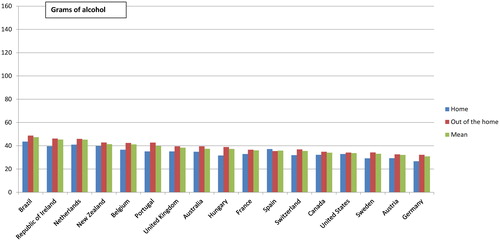
Figure 2. Comparison of alcohol (in gm) needed to reach the ideal level of intoxication and whether the preferred drinking location is within or outside of the home by country.
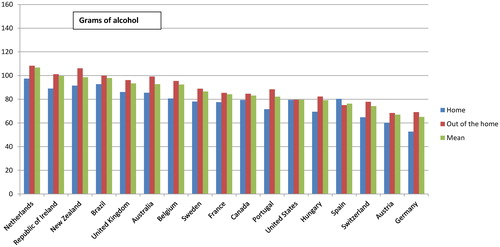
Figure 3. Comparison of alcohol (in gm) needed to reach the tipping point and whether the preferred drinking location is within or outside of the home by country.
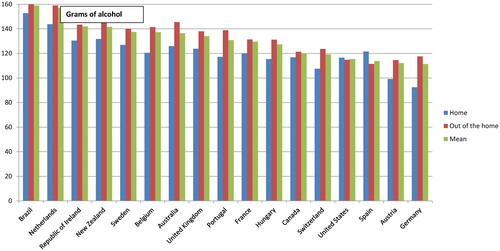
Table 2. Results of multi-level multivariable linear regression models with country included as a random effect exploring factors associated with a greater amount of alcohol in grams at each stage of intoxication.
Table 3. Results of multi-level multivariable logistic regression models with country included as a random effect.