
Figures & data
Table 1. Descriptive statistics of the COMPASS study sample, 2017/2018 to 2018/2019.
Table 2. Model fit statistics for LCA models (COMPASS Study 2017/2018–2018/2019).
Table 3. LTA model results among females in the COMPASS 2018/2019 sample.
Table 4. LTA model results among males in the COMPASS 2018/2019 sample.
Figure 1. Visual depiction of transition probabilities for different modes of cannabis use among females in the COMPASS Study (2017/2018–2018/2019). In this Sankey diagram, the size of the colored bars corresponds to the magnitude of the transition probabilities in , by which thicker bars represent greater probability.
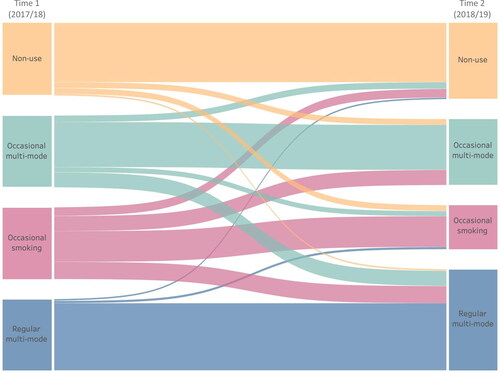
Figure 2. Visual depiction of transition probabilities for different modes of cannabis use among males in the COMPASS Study (2017/2018–2018/2019). In this Sankey diagram, the size of the colored bars corresponds to the magnitude of the transition probabilities in , by which thicker bars represent greater probability.
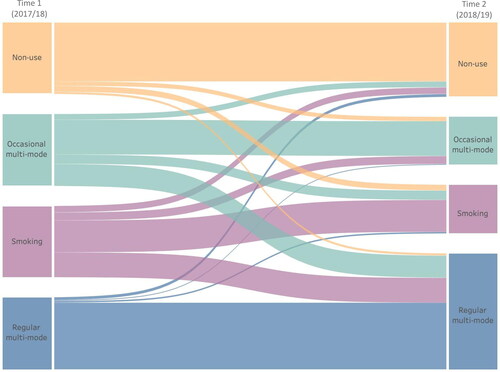
Table 5. Multinominal logistic regression model predictors of baseline class prevalence among females in the 2017/2018 COMPASS sample.
Table 6. Multinominal logistic regression model predictors of baseline class prevalence among males in the 2017/2018 COMPASS sample.
Table A1. Attrition analysis comparing baseline cannabis use between participants who were linked vs. not linked.
Table A2. Missing data analysis comparing included vs. excluded participants due to missing covariates (COMPASS 2017/2018–2018/2019).
Table A3. Invariance testing for differences by sex.