
Figures & data
Figure 1. PRISMA flowchart of search and selection process.
A flowchart that details the number of articles that were identified, screened, evaluated using eligibility criteria, and included in the review.
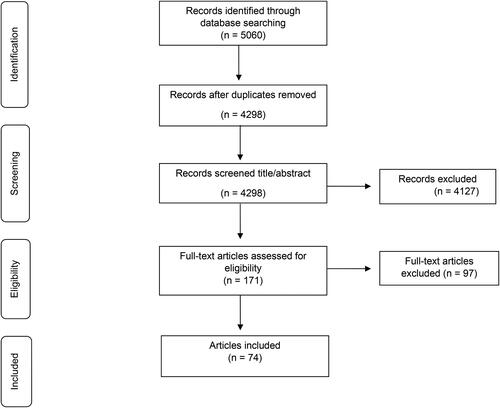
Table 1. Characteristics of the included studies.
Figure 2. Previously-identified tests used to evaluate power training and tests included in the present study.
A list of 24 tests used to evaluate power training identified in a previous systematic review and a list of 15 tests that were included in the present study.
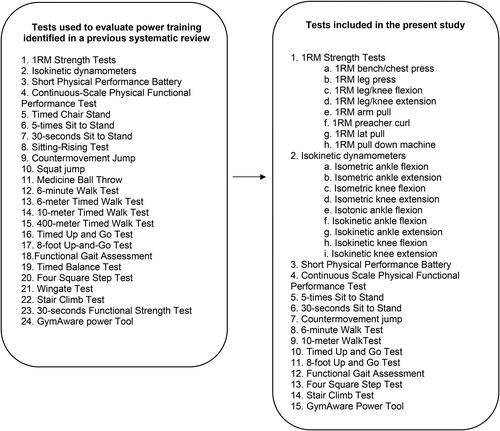
Table 2. Rating of measurement properties using terwee’s criteria.
Supplemental material
yptr_a_2376439_sm7721.pdf
Download PDF (634.6 KB)Data availability statement
data sharing is not applicable to this article as no new data were created or analyzed in this study.