
Figures & data
Table 1. Market size in billions of euros as of the end of 2012.
Table 2. Real estate derivatives market in millions of euros as of Q2 2010.
Table 3. Descriptive statistics (1996–2009).
Figure 1. Efficient sets in a mean/LPM framework.
Note: This figure shows the efficient frontiers of four different portfolios in a risk-return spectrum. These are (1) stocks and bonds, (2) stocks, bonds, and real estate ETNs, (3) previous assets within a 130/30 long-short portfolio, and (4) previous portfolio in a currency hedged setting. The expected return is represented by the mean per quarter of each portfolio and risk by LPM. The lines are the interpolation of estimated data by a second-degree polynomial.
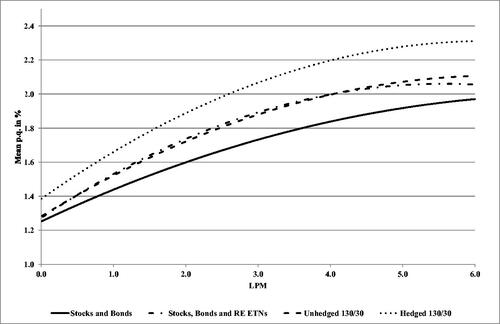
Figure 2. Composition of a hedged 130/30 long-short portfolio.
Note: This figure shows the weights of all 12 assets in the efficiently hedged 130/30 long-short portfolios along the efficient frontier. Stocks are shown horizontally, bonds are shown vertically, and real estate exchange traded notes (ETNs) are in the dotted areas.
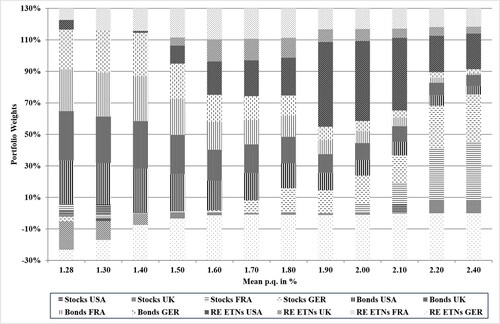
Table 4. Return/risk characteristics for the in-sample optimization.
Table 5. Optimal weights for the in-sample optimization.
Table 6. Return/risk characteristics for the out-of-sample optimization.