Figures & data
Figure 1. The structure schematic for (A) folate/TAT-PEG-OC micelles, (B) activation of folate, (C) synthesis of folate-PEG.
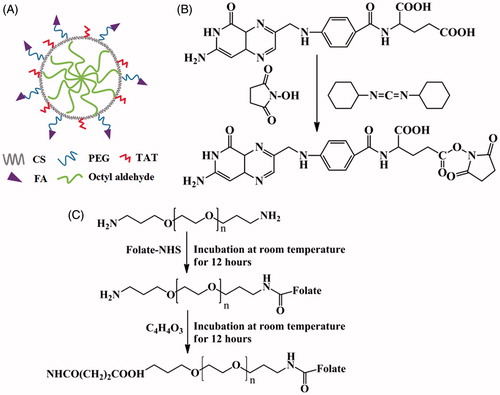
Figure 2. The 1H NMR spectra of (A) chitosan in D2O, (B) OC in D2O and DCl, and (C) folate-PEG-OC in D2O.
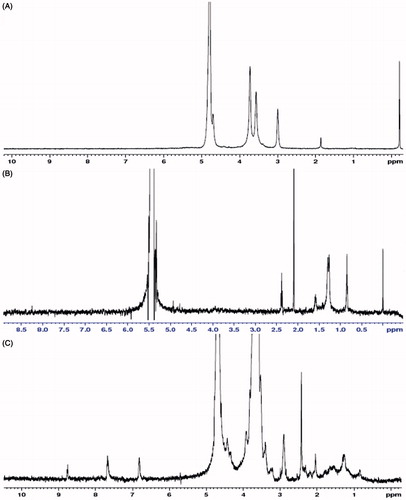
Figure 3. Size distribution of (A) folate-PEG-OC, (B) folate/TAT-PEG-OC. Transmission electron microscope (TEM) images of (C) folate-PEG-OC, (D) folate/TAT-PEG-OC.
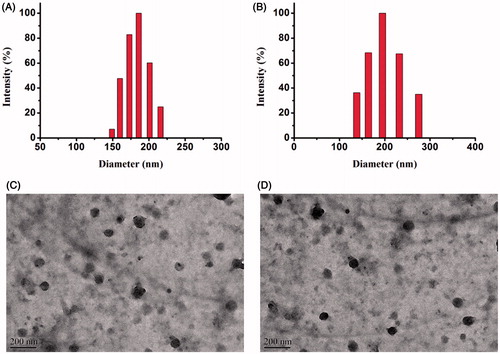
Table 1. The hydrodynamic diameter, PDI and zeta potential determined by DLS.
Figure 4. (A) Particle size distribution and (B) PDI distribution of folate-PEG-OC and folate/TAT-PEG-OC after different incubation time in serum. Data represent mean ± SD (n = 3).
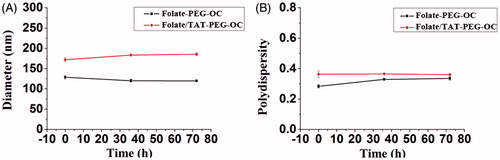
Figure 5. In vitro release of DOX from folate/TAT-PEG-OC micelles. Data represent mean ± SD (n = 3).
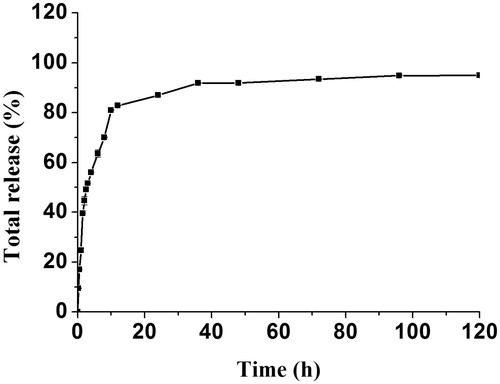
Figure 6. (A) Cytotoxicity study of folate/TAT-PEG-OC in HELF cells, (B) inhibition ratio assay of DOX, DOX/folate-PEG-OC, DOX/folate/TAT-PEG-OC micelles in Bel-7402 cells. Data represent mean ± SD (n = 6).
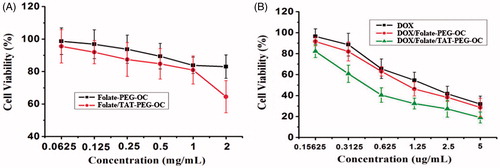
Figure 7. Confocal microscopic images of Bel-7402 cells with PEG-OC, folate-PEG-OC and folate/TAT-PEG-OC micelles containing doxorubicin for 30 min. The nucleus was stained with Hoechst 33342.
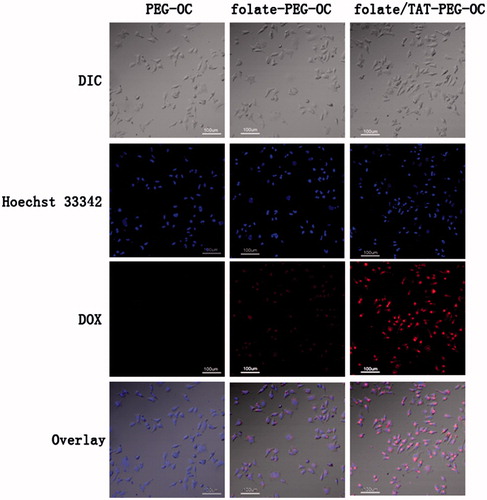
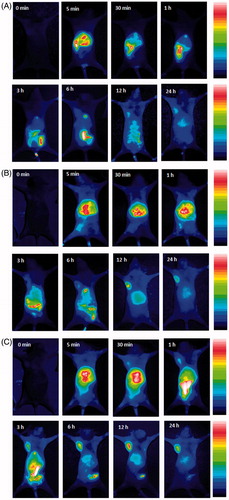
Figure 8. In vivo targeting behavior of folate/TAT-PEG-OC micelles: (A) ICG-Der-01-loaded PEG-OC micelles, (B) ICG-Der-01-loaded folate-PEG-OC micelles, (C) ICG-Der-01-loaded folate/TAT-PEG-OC micelles. Data were given as mean ± SD (n = 5).