Figures & data

Figure 1. Schematic representation of the process of fabrication and testing of the BBB model. GelMA-astrocyte suspension was deposited over the transwell membrane and crosslinked by UV exposure to generate a stable astrocyte-loaded GelMA layer. Over this GelMA-astrocyte layer, endothelial cells were seeded and allowed to proliferate and form a confluent layer of endothelial cells. GFP expressing MDA-MB-231 cells were seeded over the developed BBB model and their migration ability was examined with and without anti-cancer drug, cisplatin.
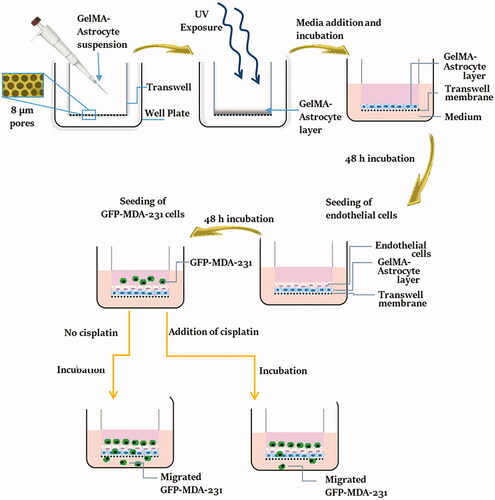
Figure 2. Morphological characterization of the Transwell-GelMA construct. SEM micrographs (A), variation in pore size (B) and variation in weight (C) after hydrogel deposition. The mean values in B and C for each group were calculated from three different SEM images and the weights of three different sets of samples, respectively. Star symbol (*) indicates the data where a statistically significant difference (p ≤ 0.05) was observed with the group of comparison.
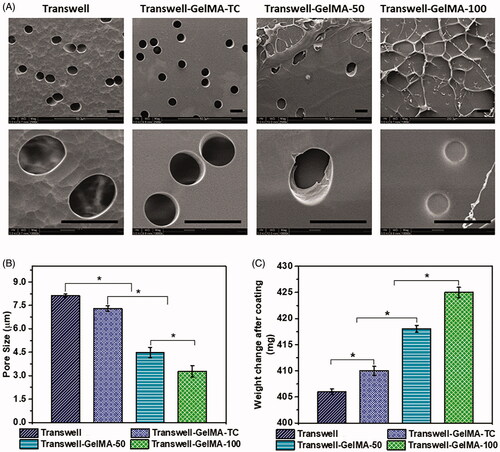
Figure 3. Representative images of live/dead assay of astrocytes embedded in GelMA hydrogel (A) and endothelial cells (B) on the top of GelMA layer of Transwell-GelMA assembly after 48 h of cell culture. Percentage of live astrocytes (C) and endothelial cells (D) calculated from live/dead assay. Scale bars, 200 µm. The mean values in B and C for each group were calculated from the results of three independent experiments.
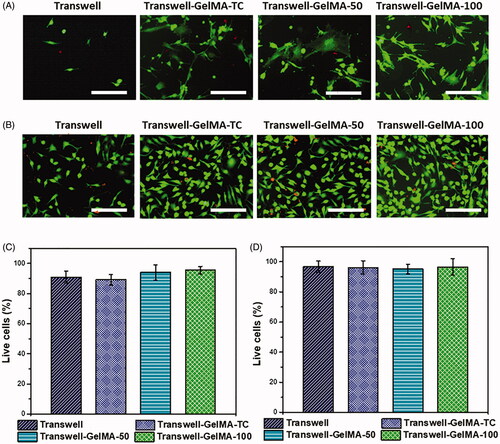
Figure 4. Microscopic images showing the proliferation of endothelial cells over Transwell-GelMA – Astrocyte layer (first column), proliferation of GFP expressing MDA-MB-231 cells over the endothelial cell layer (second column) and merged images showing the proliferation of MDA-MB-231 cells over endothelial cell layer (third column). Endothelial cells and MDA-MB-231 cells were at 72 h and 24 h after cell seeding, respectively. Scale bars, 200 µm.
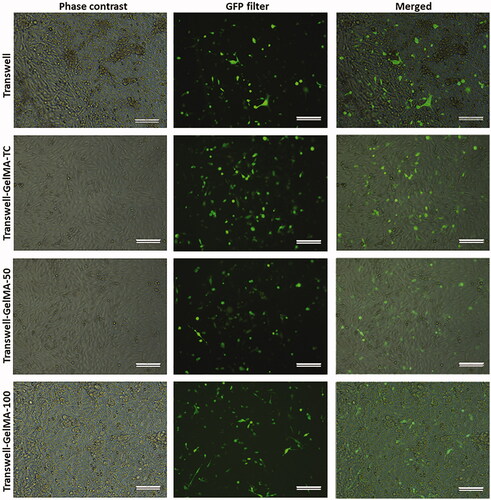
Figure 5. Results of the migration of GFP expressing MDA-MB-231 cells across developed BBB model. Migrated cells imaged by fluorescent microscope after different time periods of cell seeding (A). Quantification of migrated MDA-MB-231 cells (B). Scale bars, 200 µm. The mean values in B for each group were calculated from the results of three independent experiments.
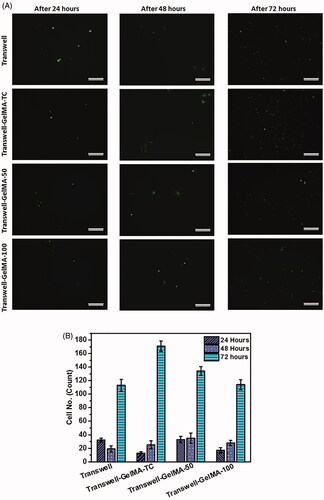
Figure 6. Testing of the developed BBB model using model drug, cisplatin. Migrated cells were imaged by fluorescent microscope after different time periods of cisplatin treatment (A). Quantification of migrated MDA-MB-231 cells after different time periods of cisplatin treatment (B). Scale bars, 200 µm. The mean values in B for each group were calculated from the results of three independent experiments. Star symbol (*) indicates the data where a statistically significant difference (p ≤ 0.05) was observed with the group of comparison.
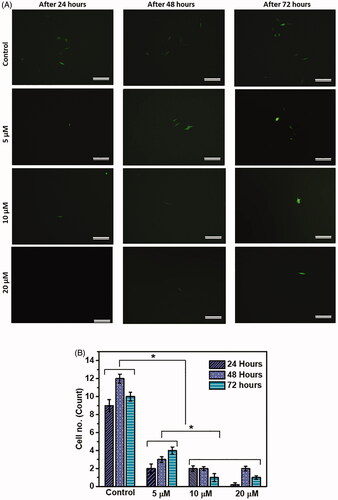
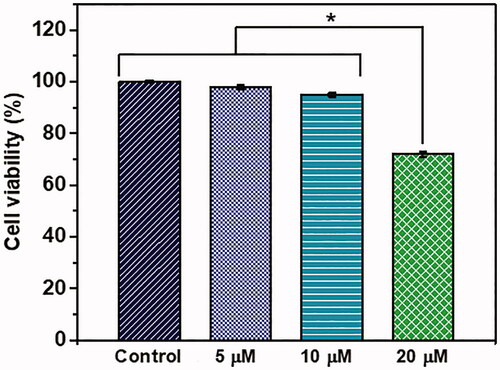
Figure 7. Viability of GFP-MDA-MB-231 cells upon treatment with different concentrations of cisplatin. The mean values in each group were calculated from the results of three independent experiments. Star symbol (*) indicates the data where a statistically significant difference (p ≤ 0.05) was observed with the group of comparison.