Figures & data
Table 1. Compounds identified in the methanol extracts of essential oil by GC-MS.
Table 2. Formulation composition and the physicochemical characterization data of the prepared PAEO-loaded SLNs (% w/w).
Figure 1. (A) Particle size distribution histogram of optimized PAEO-SLN4 and (B) TEM image of PAEO-SLN4 (Note: PAEO-SLN: Pistacia atlantica EO loaded in SLNs).
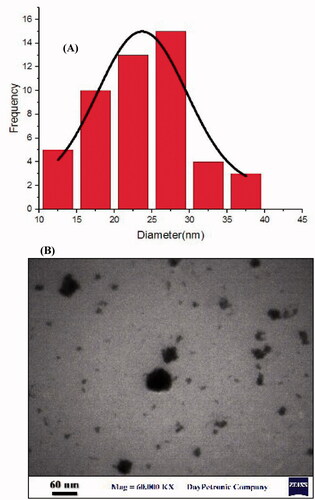
Figure 2. MDA-MB-231 cell viability after being exposed to different concentrations (50, 10, 1, 0.5, 0.1, 0.05, 0.01, and 0.005 µg/mL) of PAEO-SLN, PAEO, and placebo for (A) 24 h and (B) 48 h (Note: Data are presented as mean ± standard deviations (n = 5). PAEO-SLN: Pistacia atlantica EO loaded in SLNs).
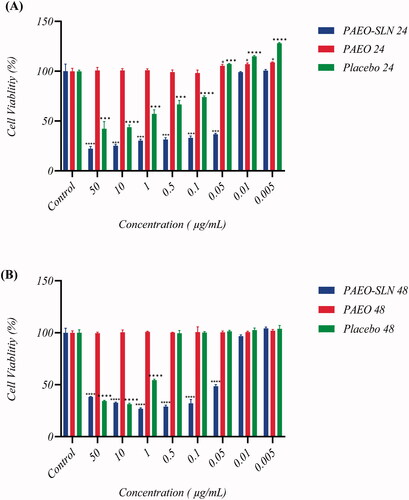
Figure 3. MDA-MB-231 cells were incubated with IC50 concentrations of PAEO-SLN and placebo for 24 h and the cell cycle in (A) control, (B) in the presence of placebo, and (C) PAEO-SLN determined by flow cytometry. (D) The quantitative analysis was plotted to show the population of cell cycle phases (Note: *P < 0.05, **P < 0.01 and ***P < 0.001 compared with the control sample. PAEO-SLN: Pistacia atlantica EO loaded in SLNs).
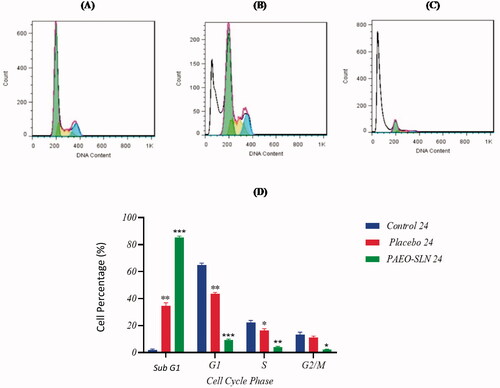
Figure 4. MDA-MB-231 cells were incubated with IC50 concentrations of PAEO-SLN and placebo for 48 h. The cell cycle (A) in control, (B) in presence of placebo, and (C) PAEO-SLN determined by flow cytometry. (D) The quantitative analysis was plotted to show the population of cell cycle phases (Note: *P < 0.05, **P < 0.01 and ****P < 0.0001 compared with the control sample. PAEO-SLN: Pistacia atlantica EO loaded in SLNs).
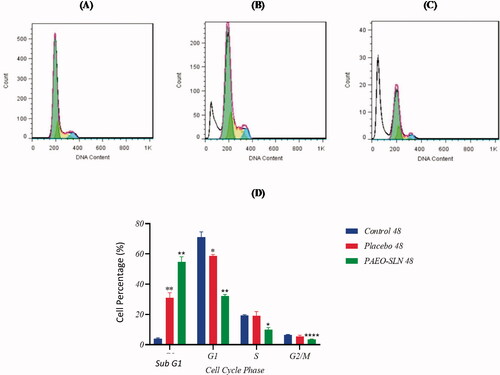
Figure 5. MDA-MB-231 cells incubated with IC50 concentrations of PAEO-SLN and placebo for 24 h and the induction of apoptosis (A) in control, (B) in presence of placebo, and (C) PAEO-SLN determined by flow cytometry. (D) The quantitative analysis was plotted to show the population of VC, EA, LA, and NC cells (Note: *P < 0.05 and ***P < 0.001 compared with the control sample. VC: viable cells; EA: early apoptotic; LA: late apoptotic; NC: necrosis cells; PI: propidium iodide; PAEO-SLN: Pistacia atlantica EO loaded in SLNs; PI: propidium iodide).
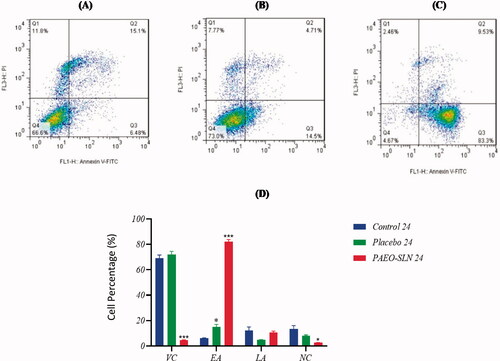
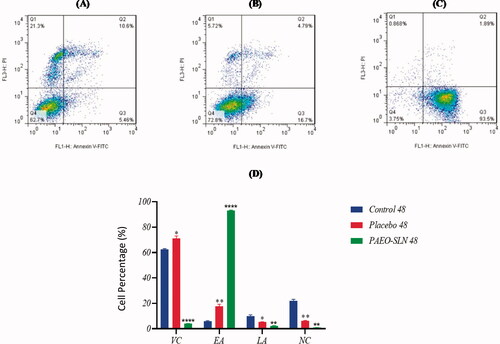
Figure 6. MDA-MB-231 cells incubated with IC50 concentrations of PAEO-SLN and placebo for 48 h and the induction of apoptosis (A) in control, (B) in presence of placebo, and (C) PAEO-SLN determined by flow cytometry. (D) The quantitative analysis was plotted to show the population of VC, EA, LA, and NC cells (Note: *P < 0.05, **P < 0.01 and ****P < 0.0001 compared with the control sample. VC, viable cells; EA, early apoptotic; LA, late apoptotic; NC, necrosis cells; PAEO-SLN, Pistacia Atlantica EO loaded in SLNs; PI, propidium iodide).