
Figures & data
Figure 1. Focus points in the supply chain for hygroscopic raw material controls.
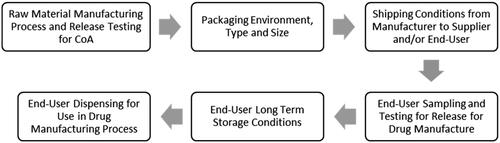
Table 1. Hygroscopicity classification.
Table 2. Data supporting hygroscopicity classification of excipients.
Table 3. Data supporting hygroscopicity classification of chemicals.
Table 4. Data supporting hygroscopicity classification of hydrates.
Table 5. Data supporting hygroscopicity classification of amino acids.
Table 6. Data supporting hygroscopicity classification of media.
Table 7. Data supporting hygroscopicity classification of liquids.
Table 8. Data supporting hygroscopicity classification of resins.
Figure 2. XRPD of L-cysteine dihydrochloride and L-cysteine hydrochloride monohydrate pre and post-DVS.
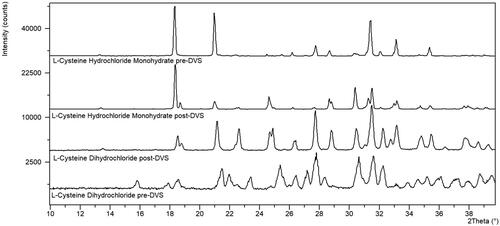
Figure 3. XRPD of L-lysine hydrochloride pre-DVS and post-DVS.
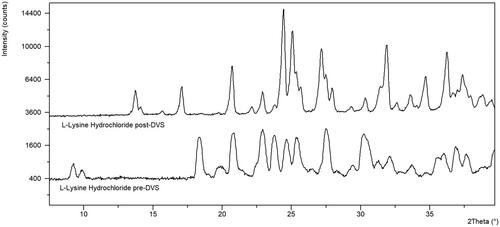
Table 9. Comparison of vapor sorption data for excipients with Murikipudi et al.
Figure 4. TRIS Hydrochloride (from supplier 1) temperature and relative humidity hygroscopicity limits.
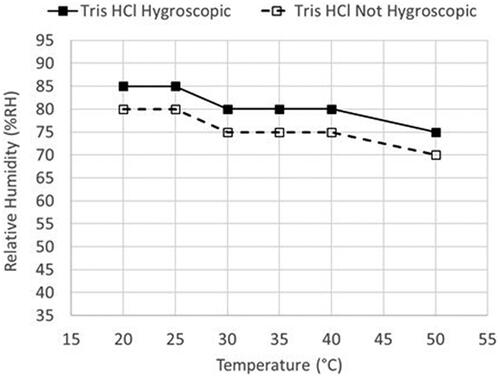
Figure 5. XRPD of dextrose from supplier 1 (0.6% wt) and supplier 2 (4.2%wt) before (pre-DVS) and after the DVS experiment (post-DVS) in comparison with dextrose monohydrate.
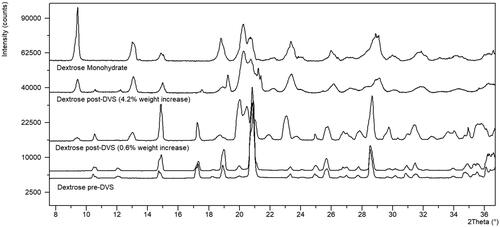
Figure 6. Polarized light microscopy of dextrose from (A) supplier 1 and (B) supplier 2 (scale bar = 100 µm).
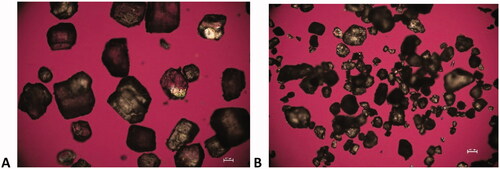
Table 10. Particle size distribution of dextrose from supplier 1 and supplier 2.