
Figures & data
Figure 1. Scanning electron microscopy (SEM) images of silica nanoparticles prepared by 2-fluid nozzle spray drying (A), silica coated silver nanoparticles prepared by 2-fluid nozzle spray drying (B), silica coated silver nanoparticles and entrapped with a layer of CFX prepared by 3-fluid nozzle spray drying (C) and silica coated silver nanoparticles inside CFX/chitosan prepared by 3-fluid nozzle spray drying (D).
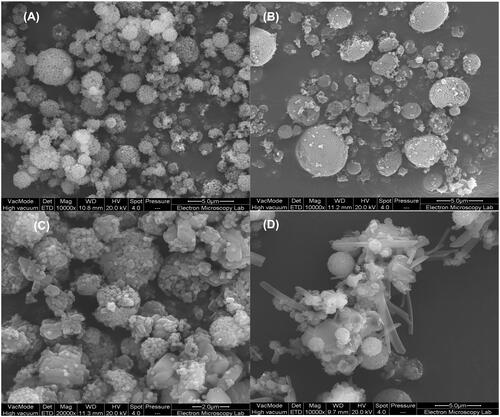
Figure 2. X-ray dispersive spectrometry (EDX) results showing surface abundance of (A) silicon (Si) and (B) silver (Ag) of samples prepared by spray drying.
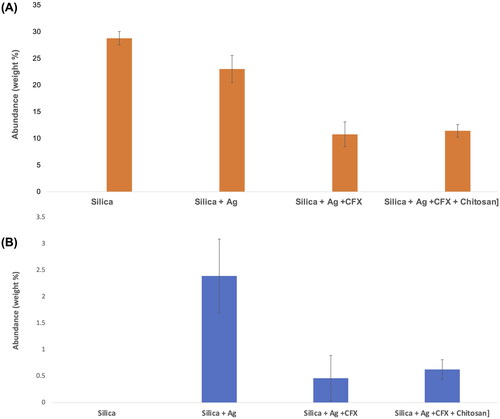
Figure 3. FTIR spectra of prepared solid dispersions prepared using two and 3-fluid nozzle spray drying along with corresponding spectra for ciprofloxacin (CFX) and chitosan. The dotted lines show peak positions in CFX where a shift was seen compared to S-AgNPs-CSCFX microparticles signifying structural changes.
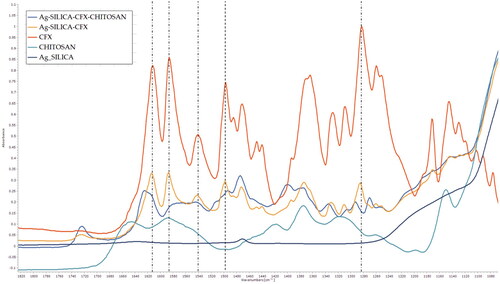
Figure 4. X-ray powder diffraction diffractograms of spray dried microparticles of silica, silica coated silver particles, silica coated silver nanoparticles loaded with CFX, and silica coated silver nanoparticles loaded with CFX and chitosan.
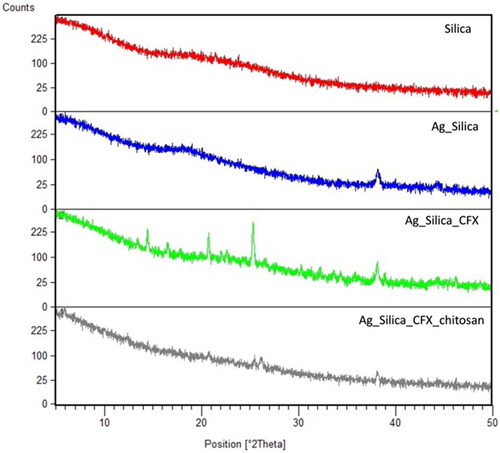
Figure 5. Transmission electron microscopy (TEM) images showing dissolution of silica coated nanoparticles inside matrix of CFX/chitosan (A) and CFX (B) prepared by 3-fluid nozzle spray drying.
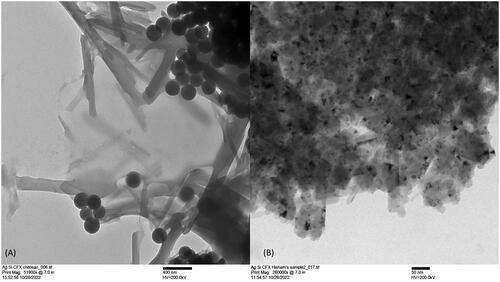
Table 1. Body weight of rats treated with blank and loaded silica-coated silver nanoparticles with ciprofloxacin.
Table 2. Serum liver function tests of rats treated with blank and loaded silica-coated silver nanoparticles with ciprofloxacin.
Table 3. Serum kidney function tests of rats treated with blank and loaded silica-coated silver nanoparticles with ciprofloxacin.
Table 4. Lipid profile and hormone values of rats treated with blank and loaded silica-coated silver nanoparticles with ciprofloxacin.
Table 5A. Hematological values of rats treated with blank and loaded silica-coated silver nanoparticles with ciprofloxacin.
Table 5B. Hematological values of rats treated with blank and loaded silica-coated silver nanoparticles with ciprofloxacin.
Figure 6. Photomicrograph of liver from groups; G1: Control negative group received (D.W); G2: Low dose group (G2) treated with 30 mg/kg of S-AgNPs-CSCFX; G3: Medium dose group (G3), treated with 60 mg/kg of S-AgNPs-CSCFX; G4: High dose group (G4) treated with 90 mg/kg of S-AgNPs-CSCFX; G5: Low dose group (G5) treated with 30 mg/kg of blank S-AgNPs; G6: Medium dose group (G6) treated with 60 mg/kg of blank S-AgNPs; G7: High dose group (G7) treated with 90 mg/kg of blank S-AgNPs. H&E. Scale bar: 4 mm.
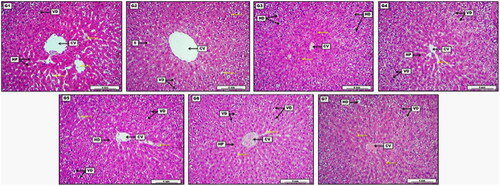
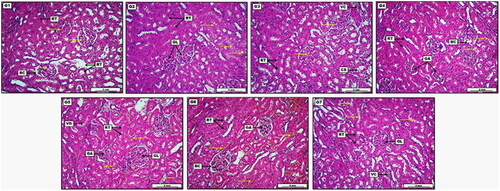
Figure 7. Photomicrograph of kidney from groups; G1: Control negative group received (D.W); G2: Low dose group (G2) treated with 30 mg/kg of S-AgNPs-CSCFX; G3: Medium dose group (G3), treated 60 mg/kg of S-AgNPs-CSCFX; G4: High dose group (G4) treated with 90 mg/kg of S-AgNPs-CSCFX; G5: Low dose group (G5), treated with 30 mg/kg of blank S-AgNPs; G6: Medium dose group (G6), treated with 60 mg/kg of blank S-AgNPs; G7: high dose group (G7), treated with 90 mg/kg of blank S-AgNPs; H&E. Scale bar: 4 mm.
Data availability Statement
The datasets used and/or analyzed during the current study are available from the corresponding author on reasonable request.