
Figures & data
Figure 1. LIVE WELL Initiative evaluation model.
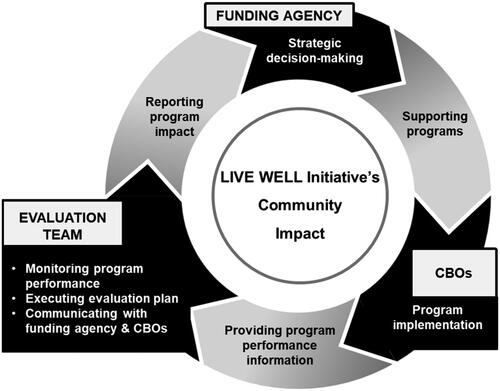
Table 1. LIVE WELL Initiative programs and characteristics.
Table 2. Outcome measures by program.
Table 3. Number of clients enrolled in the programs of LIVE WELL Initiative.
Table 4. Change in proportion in clients who rated their health good, very good, and excellent from baseline to follow-up by program.
Table 5. Change in the average number of healthy days from baseline to follow-up by program.
Table 6. Changes in program-specific outcomes from baseline to follow-up by program.
Supplemental material