
Figures & data
Figure 1. Example layout of importance-likelihood analysis graph. importance ratings are graphed on an x-y axis, providing four managerially relevant ILA quadrants: Quadrant 1: “Keep up the good work” where action is of high importance and likely to be performed, Quadrant 2: “Easy sell” where the action has above average importance but is not likely to be implemented, Quadrant 3: “Hard sell” where the action has below average importance and it is unlikely to be performed, and Quadrant 4: “Communicate value/importance” where there is high likelihood the action will be performed but respondents do not find it important.
Table 1. Result from exploratory factor analysis of DMC members’ motivation for white-tailed deer hunting from question 17 of the 2017 deer management cooperative member survey.
Table 2. Hunter motivation final cluster centers from a 2017 DMC member survey study of deer management cooperative management attributes. Positive values indicate above-average positive responses on that given motivation and negative values represent below-average response on that motivation. Degree of influence (positive or negative) is indicated by larger values above or below zero (neutral = 0).
Figure 2. Important-likelihood analysis (ILA) of member motivation-orientation cluster solitude member from a 2017 QDMA deer management cooperative survey respondents in Georgia, Missouri, Michigan, New York, and Texas, USA. Data-centered crosshairs (dotted lines) are centered to the mean responses for all cluster members. Scale‐centered crosshairs (solid line) are centered to the mean of the measurement scale. The dashed line is a 1:1 reference line. Attributes are A) Enroll in government cost-share programs (e.g., conservation reserve program, environmental quality incentive program, etc.), B) Become a member of a conservation NGO (e.g., quality deer management association, national wild turkey federation, ducks unlimited, etc.), C) Increase days per year spent on habitat management (e.g., food plots, timber stand improvement, prescribed fire, etc.), D) Increase money per year spent on habitat management, E) Specifically manage habitat for species other than white-tailed deer.
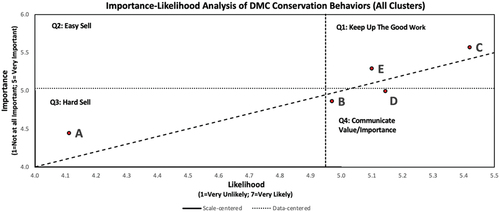
Figure 3. Important-likelihood analysis (ILA) of member motivation-orientation cluster social member from a 2017 QDMA deer management cooperative survey respondents in Georgia, Missouri, Michigan, New York, and Texas, USA. Data-centered crosshairs (dotted lines) are centered to the mean responses for all cluster members. Scale‐centered crosshairs (solid line) are centered to the mean of the measurement scale. The dashed line is a 1:1 reference line. Attributes are A) Enroll in government cost-share programs (e.g., conservation reserve program, environmental quality incentive program, etc.), B) Become a member of a conservation NGO (e.g., quality deer management association, national wild turkey federation, ducks unlimited, etc.), C) Increase days per year spent on habitat management (e.g., food plots, timber stand improvement, prescribed fire, etc.), D) Increase money per year spent on habitat management, E) Specifically manage habitat for species other than white-tailed deer.
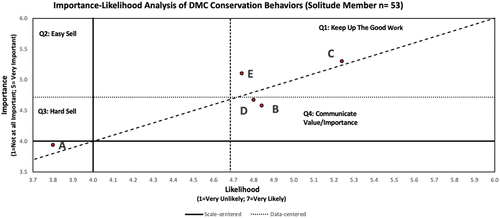
Figure 4. Important-likelihood analysis (ILA) of member motivation-orientation cluster representative member from a 2017 QDMA deer management cooperative survey respondents in Georgia, Missouri, Michigan, New York, and Texas, USA. Data-centered crosshairs (dotted lines) are centered to the mean responses for all cluster members. Scale‐centered crosshairs (solid line) are centered to the mean of the measurement scale. The dashed line is a 1:1 reference line. Attributes are A) Enroll in government cost-share programs (e.g., conservation reserve program, environmental quality incentive program), B) Become a member of a conservation NGO (e.g., quality deer management association, national wild turkey federation, ducks unlimited), C) Increase days per year spent on habitat management (e.g., food plots, timber stand improvement, prescribed fire), D) Increase money per year spent on habitat management, E) Specifically manage habitat for species other than white-tailed deer.
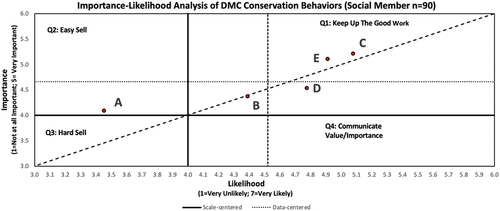
Figure 5. Important-likelihood analysis (ILA) of member motivation-orientation cluster quality harvest member from a 2017 QDMA deer management cooperative survey respondents in Georgia, Missouri, Michigan, New York, and Texas, USA. Data-centered crosshairs (dotted lines) are centered to the mean responses for all cluster members. Scale‐centered crosshairs (solid line) are centered to the mean of the measurement scale. The dashed line is a 1:1 reference line. Attributes are A) Enroll in government cost-share programs (e.g., conservation reserve program, environmental quality incentive program), B) Become a member of a conservation NGO (e.g., quality deer management association, national wild turkey federation, ducks unlimited), C) Increase days per year spent on habitat management (e.g., food plots, timber stand improvement, prescribed fire), D) Increase money per year spent on habitat management, E) Specifically manage habitat for species other than white-tailed deer.
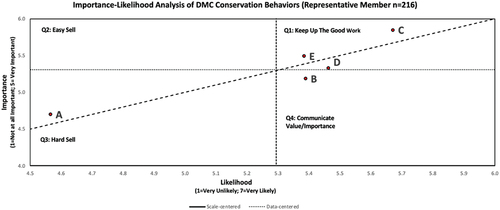
Table 3. Gender, approximated age, ethnicity, education, household income, hunting rights type, and occupation for all respondents and clusters of the 2017 QDMA DMC member survey.
Figure 6. Important-likelihood analysis (ILA) for all 2017 QDMA deer management cooperative survey respondents in Georgia, Missouri, Michigan, New York, and Texas, USA. Data-centered crosshairs (dotted lines) are centered to the mean responses for all cluster members. Scale‐centered crosshairs (solid line, axis) are centered to the mean of the measurement scale. The dashed line is a 1:1 reference line. Attributes are A) Enroll in government cost-share programs (e.g., Conservation reserve program, environmental quality incentive program), B) Become a member of a conservation NGO (e.g., Quality deer management association, national wild turkey federation, ducks unlimited), C) Increase days per year spent on habitat management (e.g., food plots, timber stand improvement, prescribed fire), D) Increase money per year spent on habitat management, E) Specifically manage habitat for species other than white-tailed deer.
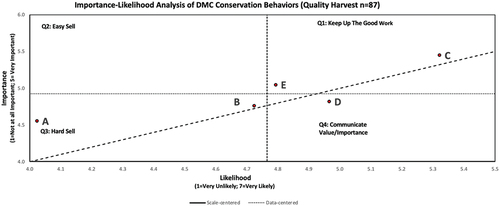
Table 4. ANOVAs results of mean importance-likelihood scores by cluster membership used for 5 deer management cooperative member conservation actions measured in a 2017 deer management cooperative survey. Bonferroni post hoc test was used to determine statistically significant differences in means, which are labeled with different letters correlated by cluster name (a,b,c,d).