Figures & data
Table 1. Forty-five subjects who successfully earned promotion from assistant to associate professor were used in this study. Eight subjects (17.8%) had 0 publications and 10 subjects (22.2%) had 0 citations in publications indexed by Thomson Reuters Web of Science while 14 subjects (31%) had received $0.00 in external funding. ‘R2’ column represents linear fit against ‘Years until promotion,’ and the ‘p-value’ column indicates probability of non-correlation with ‘Years until promotion’ using a two-way ANOVA. Overall probability for all metrics in relation to ‘Years until promotion’ was not significant at p = 0.426 (F = 1.021). A Shapiro-Wilk test revealed all factors are significantly non-normal in their distribution (p < 0.005), supporting the use of median, not mean.
Figure 1. The number of manuscripts an assistant professor published in an indexed source did not significantly correlate with the number of years spent at the rank of assistant professor before promotion (p = 0.141, m = −1.01, R2 = 0.050). Overlapping data points are offset horizontally against an ordinal x-axis.
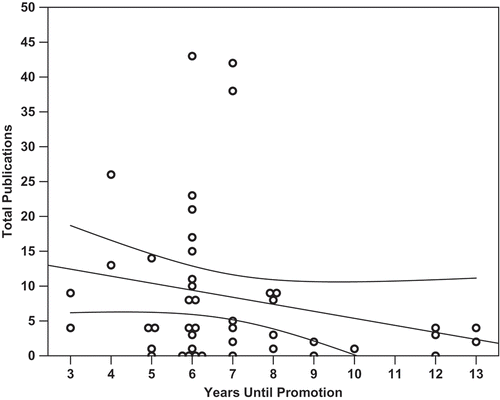
Figure 2. The h-index of an assistant professor at time of promotion did not significantly correlate with the number of years spent prior to promotion to associate. (p = 0.210, m = −0.33, R2 = 0.036). Overlapping data points are offset horizontally against an ordinal x-axis.
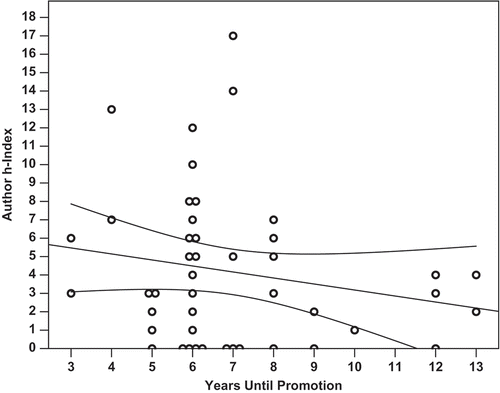
Figure 3. The amount of external funding a faculty member received did not significantly correlate with the number of years they spent earning promotion (p = 0.753, m = -$60 700/year, y-int = $1 430 000, R2 = 0.002). The data indicates the median amount of external funding a faculty member has received prior to promotion to associate professor is $9910, regardless of the number of years spent earning promotion. A total of 14 of 45 subjects (31%) received $0 in external funding and four subjects (8.9%) received between $1 and $8000. Overlapping data points are offset horizontally against an ordinal x-axis.
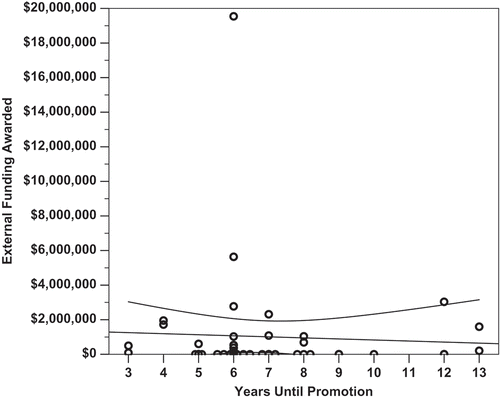
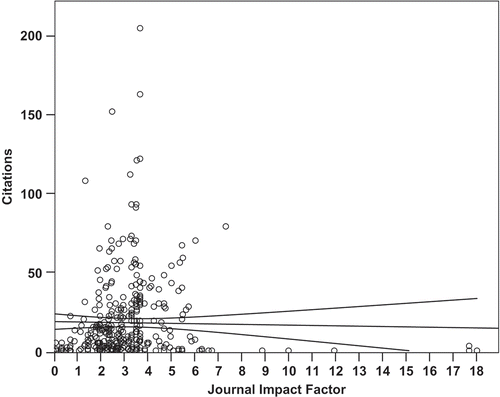
Figure 4. The total number of citations an assistant professor receives is loosely but significantly correlated with the amount of external funding received prior to promotion to associate. (p = 0.007, m = $5870 per citation, y-intercept of $288 000, R2 = 0.159, CI: ±$910 666.13).
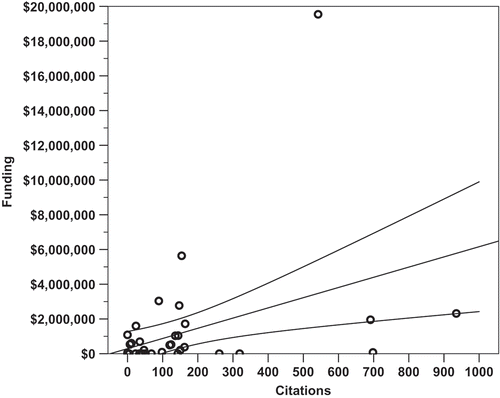
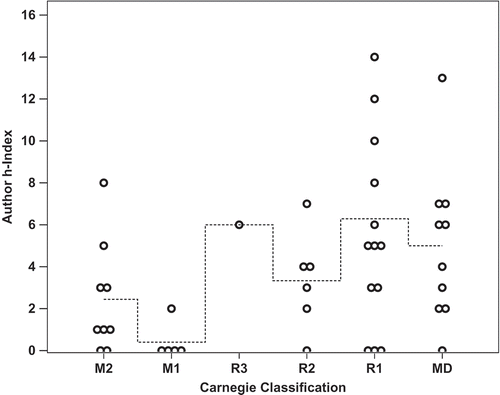
Figure 5. The Carnegie Classification of the promoting institution neither significantly nor closely correlated with the faculty research productivity metrics used in this study, as analysed by linear regression (p = 0.213, R2 = 0.216). Shown here is the author h-index of faculty within the Carnegie Classifications of their promoting institutions (p = 0.040, R2 = 0.141; m = 0.83, y-intercept = 1.77). Dashed line represents the stepped mean of faculty h-index faculty from within each classification.
