Figures & data
Table 1. Basic information from Marshall and University of Toledo Programs.
Figure 1. Panel A: Histogram of resident scores in Marshall IM for question 3. In contrast for the third subject in the Marshall IM program, all Likert scores were exactly 4. Panel B: Boxplot of Average Variance in Likert Score within each resident. Panel C: Boxplot of Average Variance in Likert Score across questions amongst (between) all residents. Data in Panels B and C shown as mean ± SD. Note that with one exception (UT Pediatrics), the average variance in Likert scores is greater between residents than within residents.
Figure 2. Box plots showing distribution of scores per individual resident. Median marked with solid line, box traverses 1st and 3rd quartile. Outlier values marked as solid circles. Data demonstrates the variability of scoring is greater between residents (residents numbered on x axis) than between Likert questions applied to the individual resident (y range) in somewhat different way that above.
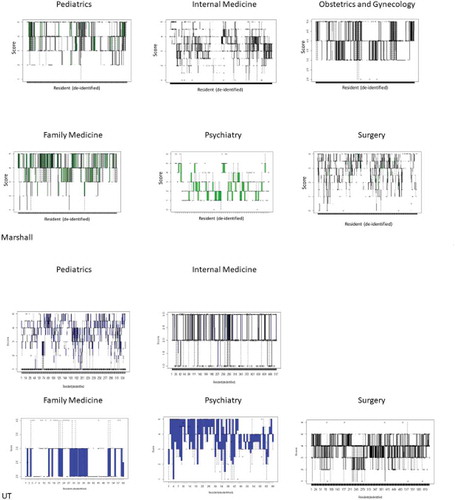
Table 2. Correlations on forms from Marshall and University of Toledo Programs.
Figure 3. Correlation heat maps with network groupings shown for Marshall (top Panel) and UT (bottom Panel) residency programs. Color code for correlations shown on graphs. Network groupings fixed by R software using the command heatmap.2 within the package gplots. The results depict correlation between items with highly correlated items coded light green, as demonstrated by the line of identity for identical items that are displayed from bottom left to top right, to less well correlated items that are depicted in in darker shades.
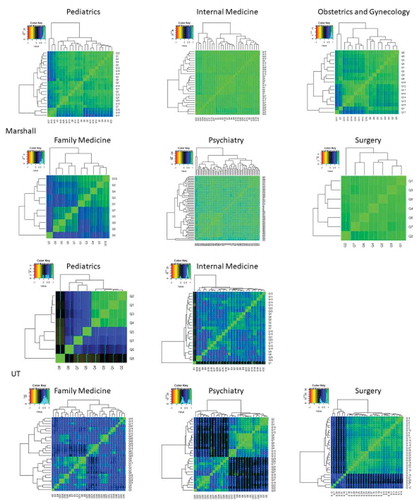
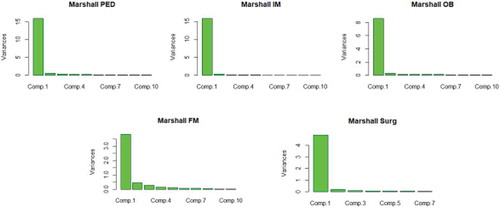
Figure 4. Principal component analysis of Marshall Residency programs. Note that for all programs, the first principal component contained the vast majority of information. In fact, for all programs, more than 95% of variance was contained within first 5 principal components. For FM, the distribution of significant variance went up to the 5th component whereas for other programs, it was limited to the first 1 or 2.