Figures & data
Table 1. General characteristics and psychological factor scores of study participants
Table 2. Centrality indices of the multidimensional network of psychological factors in a sample of 878 medical students
Figure 1. (a) Network structure and (b) centrality indices of psychological beliefs and attitudes among a total of 878 medical students
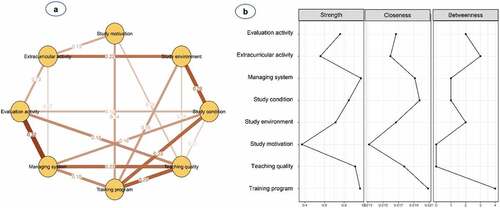
Figure 2. (a) Network structure and (b) centrality indices of psychological beliefs and attitudes among 376 medical male students
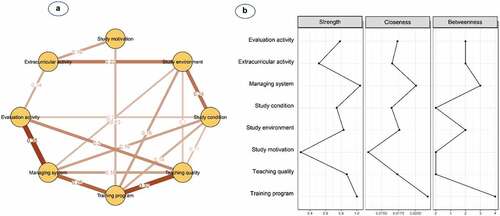
Figure 3. (a) Network structure and (b) centrality indices of psychological beliefs and attitudes among 502 medical female students
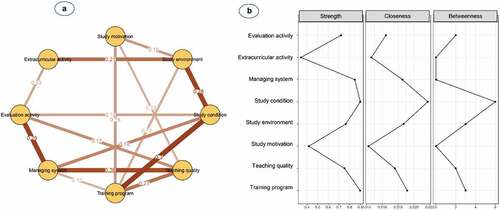
Figure 4. (a) Network structure and (b) centrality indices of psychological beliefs and attitudes among 255 freshmen medical students
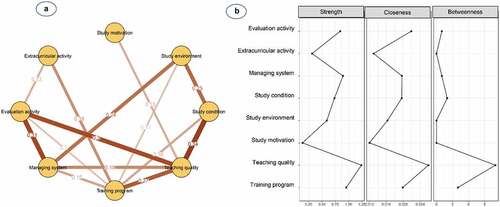
Figure 5. (a) Network structure and (b) centrality indices of psychological beliefs and attitudes among 297 junior medical male students
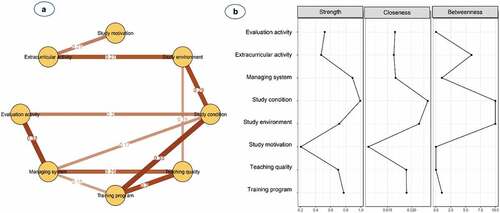
Figure 6. (a) Network structure and (b) centrality indices of psychological beliefs and attitudes among 326 senior medical female students
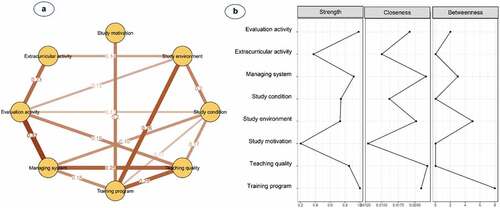
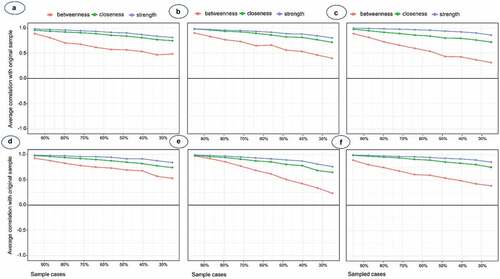
Table 3. Maximum proportions to retain correlation of 0.7 between node centrality and the original sample
Figure 7. Graphical depiction for the stability of network centrality indices of (a) total, (b) male, (c) female, (d) freshmen, (e) junior; and (f) senior students